We may earn a commission if you make a purchase through the links on our website.
Why is Monitoring Your Application Important?
UPDATED: April 28, 2025
Outages of any kind can cause significant issues for a business, costs could be incurred in the form of potential lost customers, the mitigation of any issues, lost transaction data, and customer support for the aftermath. The costs can quickly add up from even a single outage, and aren’t always obvious when looking at just the numbers. But while outages are obvious, server infrastructure can suffer from more than just blackouts; brownouts, and performance degradations that often go unnoticed by the hosts but are noticed by end users, and can be just as costly in the long run.
Here is our list of the best application monitoring tools:
- ManageEngine Applications Manager – EDITOR’S CHOICE Offers deep analysis and visibility into critical application and infrastructure components to improve user experience. Start a 30-day free trial.
- Site24x7 – FREE TRIAL Tracks all applications and offers key metrics for checking real-time security and performance. Start a 30-day free trial.
- Datadog APM Includes RUM (real-time user monitoring data), security signals, and more to detect the root cause across applications and infrastructure to ensure a good user experience.
Maintaining consistent performance on your network is critical to keeping customers. Think of it like a restaurant; if customers aren’t able to get a table, or if their meal takes too long to serve, it doesn’t matter how good the food is, as it will be marred by the frustrations caused by the service that was delivered. In this example, while you’re going to get a sale out of this one visit, they’re less likely to come to the restaurant in the future. Performance leads to retention.
Depending on your infrastructure, performance issues, and blackouts/brownouts will also undoubtedly affect the productivity of your internal users too. While retention isn’t a concern, according to a recent OnePoll study, employees waste 44 minutes each week on average due to slow network performance and connectivity.
These issues are especially true of your application infrastructure since this is typically what your end users are interacting with directly. Poor application performance also often goes unnoticed, since it is often monitored as part of the larger network infrastructure, instead of being monitored independently. This means that the data being monitored doesn’t always tell the full picture.
Performance Metrics
So distinguishing between Application Performance Monitoring (APM) and regular Network Performance Monitoring (NPM) is important because the data sets are innately but subtly different—but how are they different?
To provide visibility into the performance of the application components, APM is carried out by delving deeply into the application itself and its live code. They could be on a single machine or widely spread, and more sophisticated technologies will perform end-to-end transaction tracing. Ultimately, NPM prioritizes the focus on the conditions of the hardware, while APM is instead focused strictly on the related software.
The most important metrics that your application monitoring should focus on are average response time, error rates, request rate, application and server CPU, memory, and application availability. Some app languages such as Java also use something called Garbage Collection, which is the process of cleaning up memory usage in your applications, which is also the kind of thing you should prioritize monitoring as part of your APM.
Apdex is another important performance metric to track that is unique to application performance monitoring. It is a decimal score that ranges between 0 and 1, and it serves as an abstract indication of your end user’s overall experience, namely relating to the ability to access your services smoothly, quickly, and consistently.
Security Risks
Monitoring your applications goes beyond merely ensuring solid performance—it is also vital to the security of your network infrastructure. Most hacks and exploits will take advantage of your application software, meaning these kinds of vulnerabilities aren’t always detected as part of traditional network monitoring. But anomalous readings generated as part of your software metrics are straightforward for software-focused APM solutions to identify.
This is especially important when using third-party applications since vulnerabilities are more likely to be found and exploited in broadly used applications. You are still responsible for ensuring the safety of your application data even when the code was created by a different organization.
By analyzing transaction data, anomalous readings, usage spikes, and other metrics you can quickly identify where malicious access is affecting your network. There is even a whole branch of monitoring called Application Security Monitoring (ASM) that sits alongside APM as an important part of your monitoring duties.
How to Monitor your Applications
So how do you go about monitoring your application data? Well, this is where application monitoring tools come into play. Application monitoring tools fulfill the requirements for accurate APM and ASM in the same way that network monitoring tools provide accurate data on your hardware. There’s a lot of overlap between these kinds of tools, and some of the best network monitors on the market also handle application monitoring either as part of their core lineup or as side products that can be expanded into your network.
These tools integrate with your applications on a software level, analyzing the infrastructure on a code level, using plugins and logging metrics. When determining which application monitoring tool to choose, the available integrations are often the deciding factor, since you need to ensure that all of your applications are compatible with the tool you’re using.
If you are using third-party applications that aren’t compatible with a certain tool, or you use bespoke or in-house-produced applications, then this is where APIs come into play. You’ll need to have the capabilities and know-how within your team to handle the development of API integration with your products, but many application monitors come with an API to ensure you can integrate with their solution.
The Leading Application Monitoring Tools
When it comes to finding an application monitoring tool, we have you covered with four excellent recommendations from four of the best application monitoring tools on the market. Each of these tools boasts scalable, widely integratable solutions that are perfect for your monitoring requirements. Ensure that you look through our full run-throughs of each of the products below to determine which is the best product for you.
If you’re struggling to decide what to even look for in an application monitoring tool, then note that there are a few key components to keep in mind. As mentioned above, one of the most important options is the available integrations—if the solution can’t handle your applications, it’s probably not the one for you. All four of the solutions we have listed below also include rigorously documented APIs.
It’s also important to distinguish application monitoring from the often-confused application performance management—since ‘APM’ is an acronym used for both, they’re often conflated with one another, but this doesn’t really matter too much, since they both ultimately do similar things. Just note that managing your application data through things like load balancing, is also presented as a feature of a number of these application monitoring tools.
Our methodology for selecting an application monitoring tool
We reviewed the market for application monitoring systems and analyzed tools based on the following criteria:
- Clear goals about monitoring objectives like performance, scalability, availability, security, and more.
- Compatibility and integrations with your current operating systems, databases, cloud platforms, and programming languages.
- Monitoring capabilities like real-time monitoring, alerting, diagnostics, root cause analysis, and troubleshooting.
- Key metrics like response time, throughput, error rates, resource utilization, and latency.
- Security features, including data encryption, access controls, compliance standards support, and vulnerability detection.
- Documentation, tutorials, and community resources available to facilitate implementation.
- Total cost of ownership, including upfront costs, licensing fees, maintenance, training, and potential scalability costs.
1. ManageEngine Applications Manager – FREE TRIAL
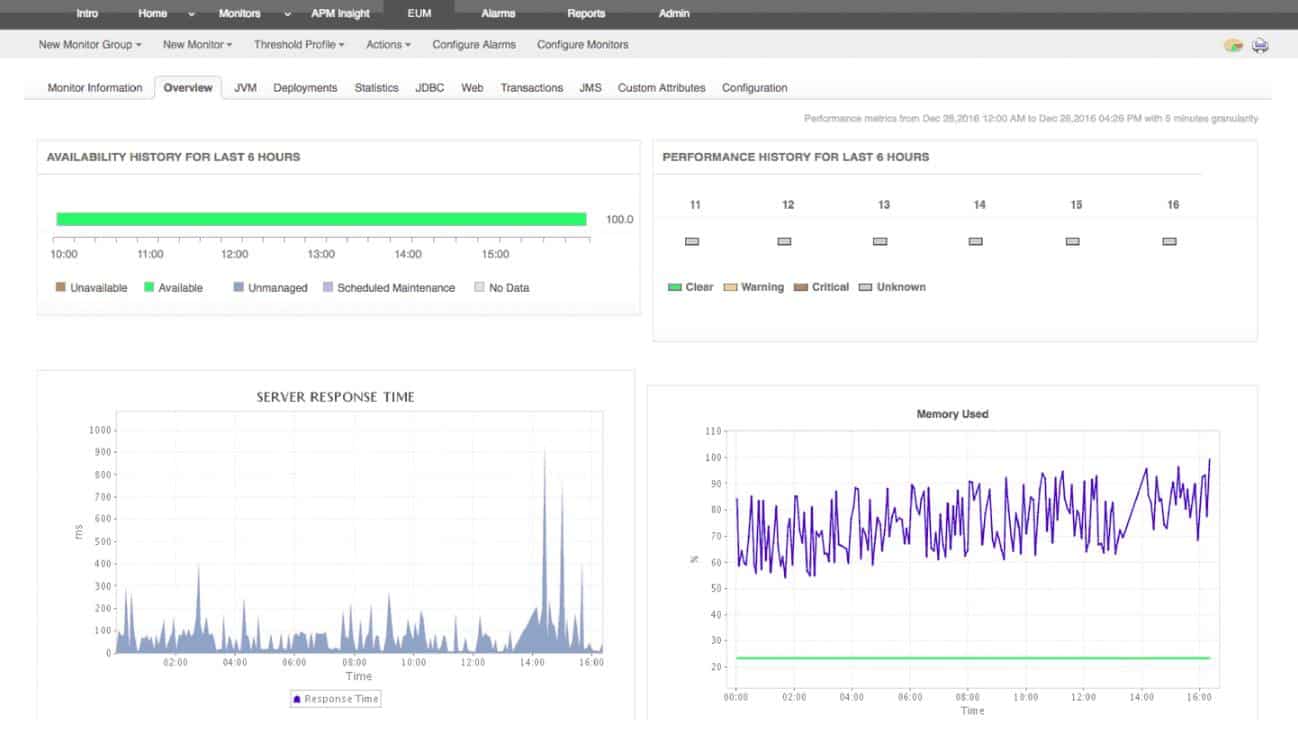
ManageEngine Applications Manager can provide detailed performance measurements and keep an eye on your application capacity information. By making sure that your applications have appropriate resources and effectively planning for capacity, you can prevent outages and mitigate issues with server performance and health in physical, virtual, and cloud settings. Additionally, the monitoring tool may look up front-end data such as client connections, and analyze typical user activity.
Key Features:
- Multi-Cloud Monitoring: Monitor workload and troubleshoot applications for your cloud, private and public networks.
- Database Monitoring: Focuses on identifying the database issues that can impact application monitoring.
- Real User Monitoring: Provides detailed information on network, web transactions, front-end and back-end response times.
- Website Monitoring: Helps in monitoring website performance and internet services such as HTTPS, DNS server, SNMP, POP, TLS, SSL.
Why do we recommend it?
We recommend ManageEngine Applications Manager for its comprehensive application performance monitoring capabilities. It provides extensive insight into the functionality and user experience of crucial infrastructure and application components. The tool facilitates the rapid detection and resolution of performance problems throughout the whole application stack with features like distributed transaction tracing, code-level insights, and application service mapping. Applications Manager enables users to efficiently monitor and troubleshoot application performance in development, testing, and production environments, guaranteeing optimal functionality and user satisfaction.
The customizable dashboards may substantially simplify data monitoring by comparing your frontend and backend metrics while identifying hotspots. Additionally, notifications can be configured to notify you whenever your application’s health is at risk— AI-assisted proactive detection of anomalies based on shifting baselines can help you find the precise and quick solution to issues with static and dynamic thresholds.
Database issues that affect application performance can be quickly found and fixed, this includes analyzing SQL queries to monitor and detect slow database calls. Many different databases, including RDBMS, NoSQL, in-memory, and huge data stores, may be monitored without needing agents. The general performance and accessibility of well-known ERP programs like SAP, Oracle EBS, Microsoft Dynamics CRM & AX, and Siebel CRM can also be improved by easily recognizing performance problems and bottlenecks in advance.
Who is it recommended for?
For enterprises of all sizes seeking to improve and automate their DevOps and IT processes, Applications Manager is the best tool to guarantee maximum end-user happiness and enhanced business outcomes. Because it offers visibility into private, public, and hybrid cloud infrastructures, users can easily troubleshoot application performance issues and monitor workloads. Applications Manager integrates seamlessly with top cloud and virtualization platforms, including AWS, Azure, GCP, Oracle Cloud, and OpenStack, enabling companies to maximize their resources and provide outstanding performance in a variety of IT environments.
Pros:
- Reduce MTTR: Helps to know resource usage and detect issues to fine-tune the day-to-day business operations.
- Optimize Application Usage and Revenue: Allows business owners to plan their revenue by analyzing customer experience and knowing the pin points where they need to work.
- Faster Incident Response: Easily spot application and infrastructure issues, solve them quickly, and resolve complaints quickly.
- Cloud Migration: Offers deep visibility to maintain the platform’s reliability and ensure risk-free cloud migration.
Cons:
- Limited Customization: Many users find this expensive for ITSM and reported that this tool has limited customization options.
The $395 annual cost of the Professional version includes ten different service monitors, or you may pay $795 for a perpetual license. The cost of the Professional version scales with the number of monitors up to 250. The annual starting price for 250 displays in the Enterprise edition, which scales higher, is $9,595.
The website offers a free download of ManageEngine Applications Manager, which supports up to 5 servers or apps under observation. A free trial is also available for the service’s Professional and Enterprise editions.
2. Site24x7 – FREE TRIAL
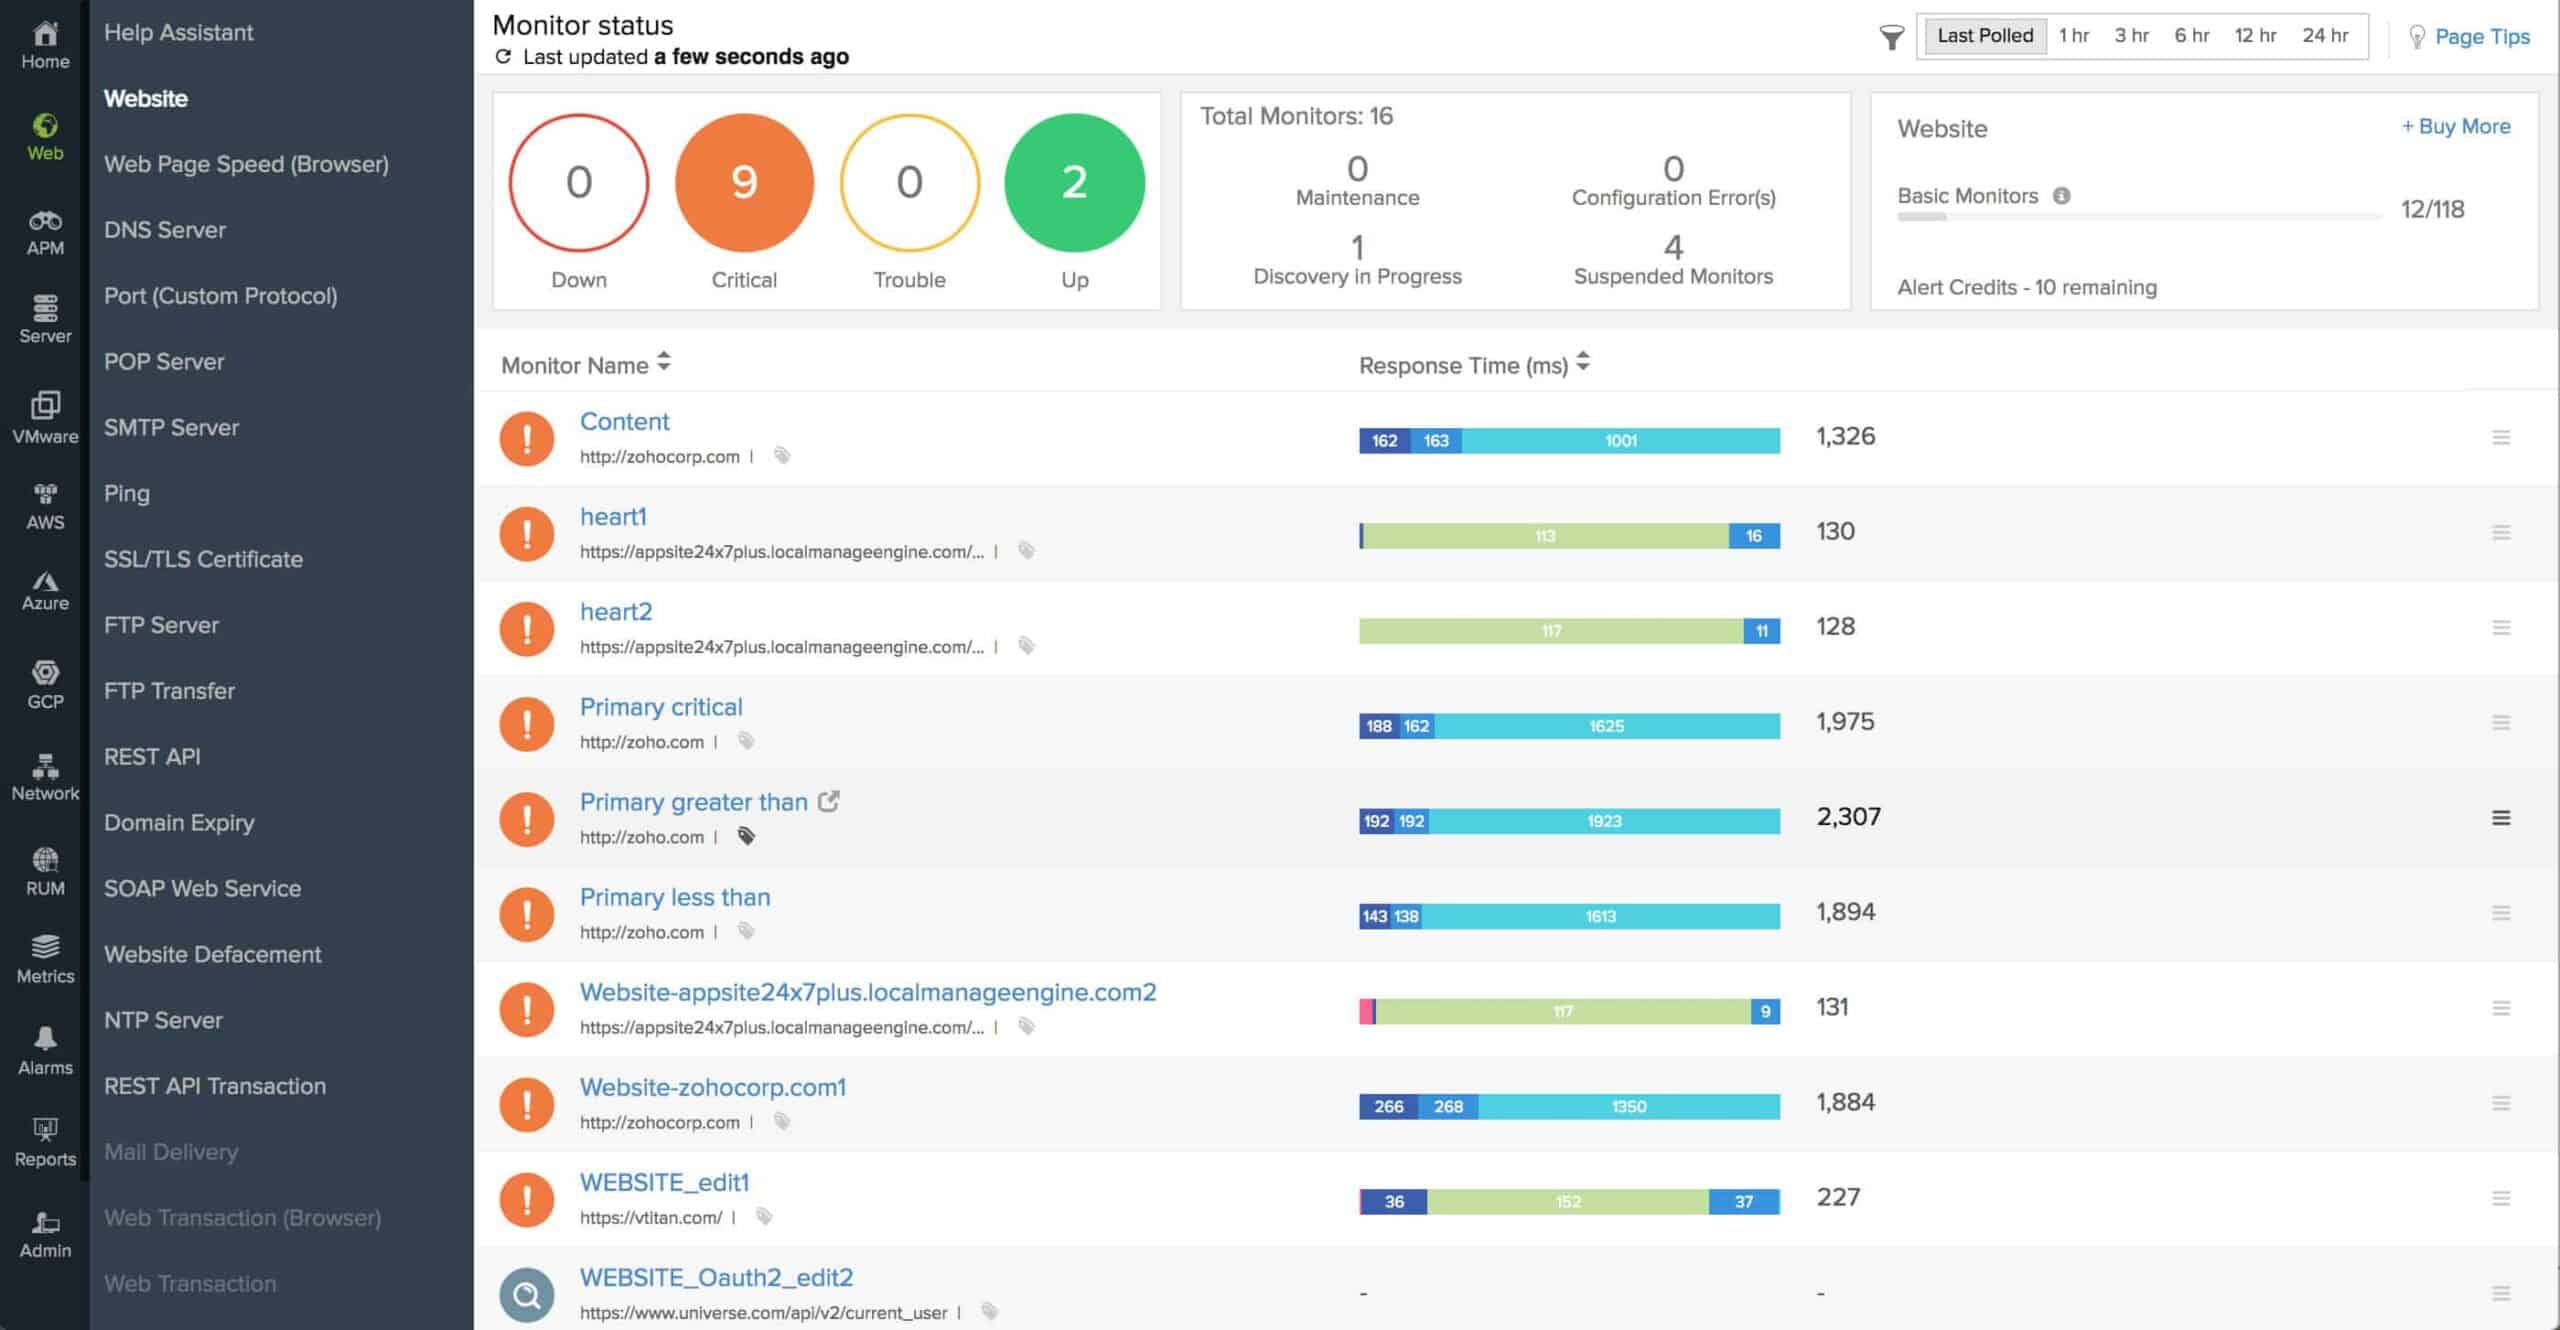
Site24x7 stands out in the domain of application monitoring tools, offering a comprehensive solution for modern enterprises that need to ensure the optimal performance and reliability of their applications. It’s particularly effective for organizations looking to monitor a wide range of applications, from web-based to cloud-native applications, providing deep insights into performance metrics and user experience. Site24x7 provides extensive insights into application performance, backed by user experience data and application topology mapping. This makes it a valuable tool for comprehensive application monitoring.
Key Features:
- Distributed Tracing: Reduces meantime (MTTR) and allows the monitoring of transactions and other microservices.
- Application Visualization: Holistic view of SQL queries and URLs for components, architecture, and applications.
- Capture Golden Metrics: Groups key metrics and captures golden signals to identify critical infrastructure transactions.
- AI-Powered Troubleshooting: Users can maintain service level agreements with AIops to detect unusual behavior and anomalies.
Why do we recommend it?
We recommend Site24x7 because it is the best AI powered APM solution that every organization must use for ensuring reliability, security and performance. It offers a 30-day free trial to use the advanced features for free, explore more about critical points, and gain deeper observability. This tool has also got many rewards and recognition for application performance monitoring, observability solutions and much more. Hence, this is what makes it the perfect tool for improving user experience.
Site24x7 is recommended for its detailed application performance monitoring capabilities, which include user experience tracking and application dependency mapping. Its comprehensive approach helps in identifying and resolving application performance issues promptly and effectively.
Who is it recommended for?
The tool is used by a wider range of organizations, networks, security experts, and other IT people. It helps to constantly monitor the business to track good performance metrics and resolve critical bottlenecks for seamless operation. You can respond quickly to user downtimes and other issues. It guaranteed up to 98% reduced database calls and 90% of SQL query optimization.
Pros:
- Responds to Critical Alerts: Uses machine learning and other forecasting techniques to take quick action for critical alerts.
- 360-Degree View: The user can have both front-end and back-end views of the application.
- 30-Day Free Trial: Try this tool for monitoring and fulfill security aspects for 30 days to understand real metrics and detailed observability.
- Debug Methods and Errors: Detects component failure and external anomalies to understand external dependency mapping.
Cons:
- Unnecessary Alerts: Users had noted unnecessary alerts, which might cause memory issues if ignored consistently.
Site24x7’s extensive monitoring features make it suitable for environments where maintaining high application performance and availability is critical. You can access a 30-day free trial.
3. Datadog APM
The installation agent for Datadog includes packages for numerous integrations, making setup for full monitoring of your applications straightforward and quick to perform. Additionally, you can use the solution’s completely customizable dashboards to track your front-end and back-end traffic data. You can customize setup limitations and alerting systems to make sure you monitor the condition of your application servers.
Key Features:
- Code Level Tracing: Focuses on improving app performance and the overall security structure of the organization and optimizing resource consumption.
- Service Observability: Provides a centralized view of infrastructure health and databases for incident remediation and detect the source issues.
- Deployment Tracking: Resolves high alerts and other performance degradation, automatically groups error sets and resolves according to priority.
- ML/AI: Uses machine learning and artificial intelligence to understand the impact on service, users, change in performance metrics and overall view.
Why do we recommend it?
Datadog APM can help you improve Mean Time to Resolution (MTTR) through automated root cause analysis, minimizing service disruptions and user impact. Its customizable dashboards and actionable alerts make it easy to work in a group with great collaboration. By speeding up the feedback cycles, guaranteeing faster deployment of high-quality apps, and optimizing the testing of early code changes in feature and development branches, Datadog APM also saves developers’ time. It’s an effective technique for encouraging cooperation and maximizing performance.
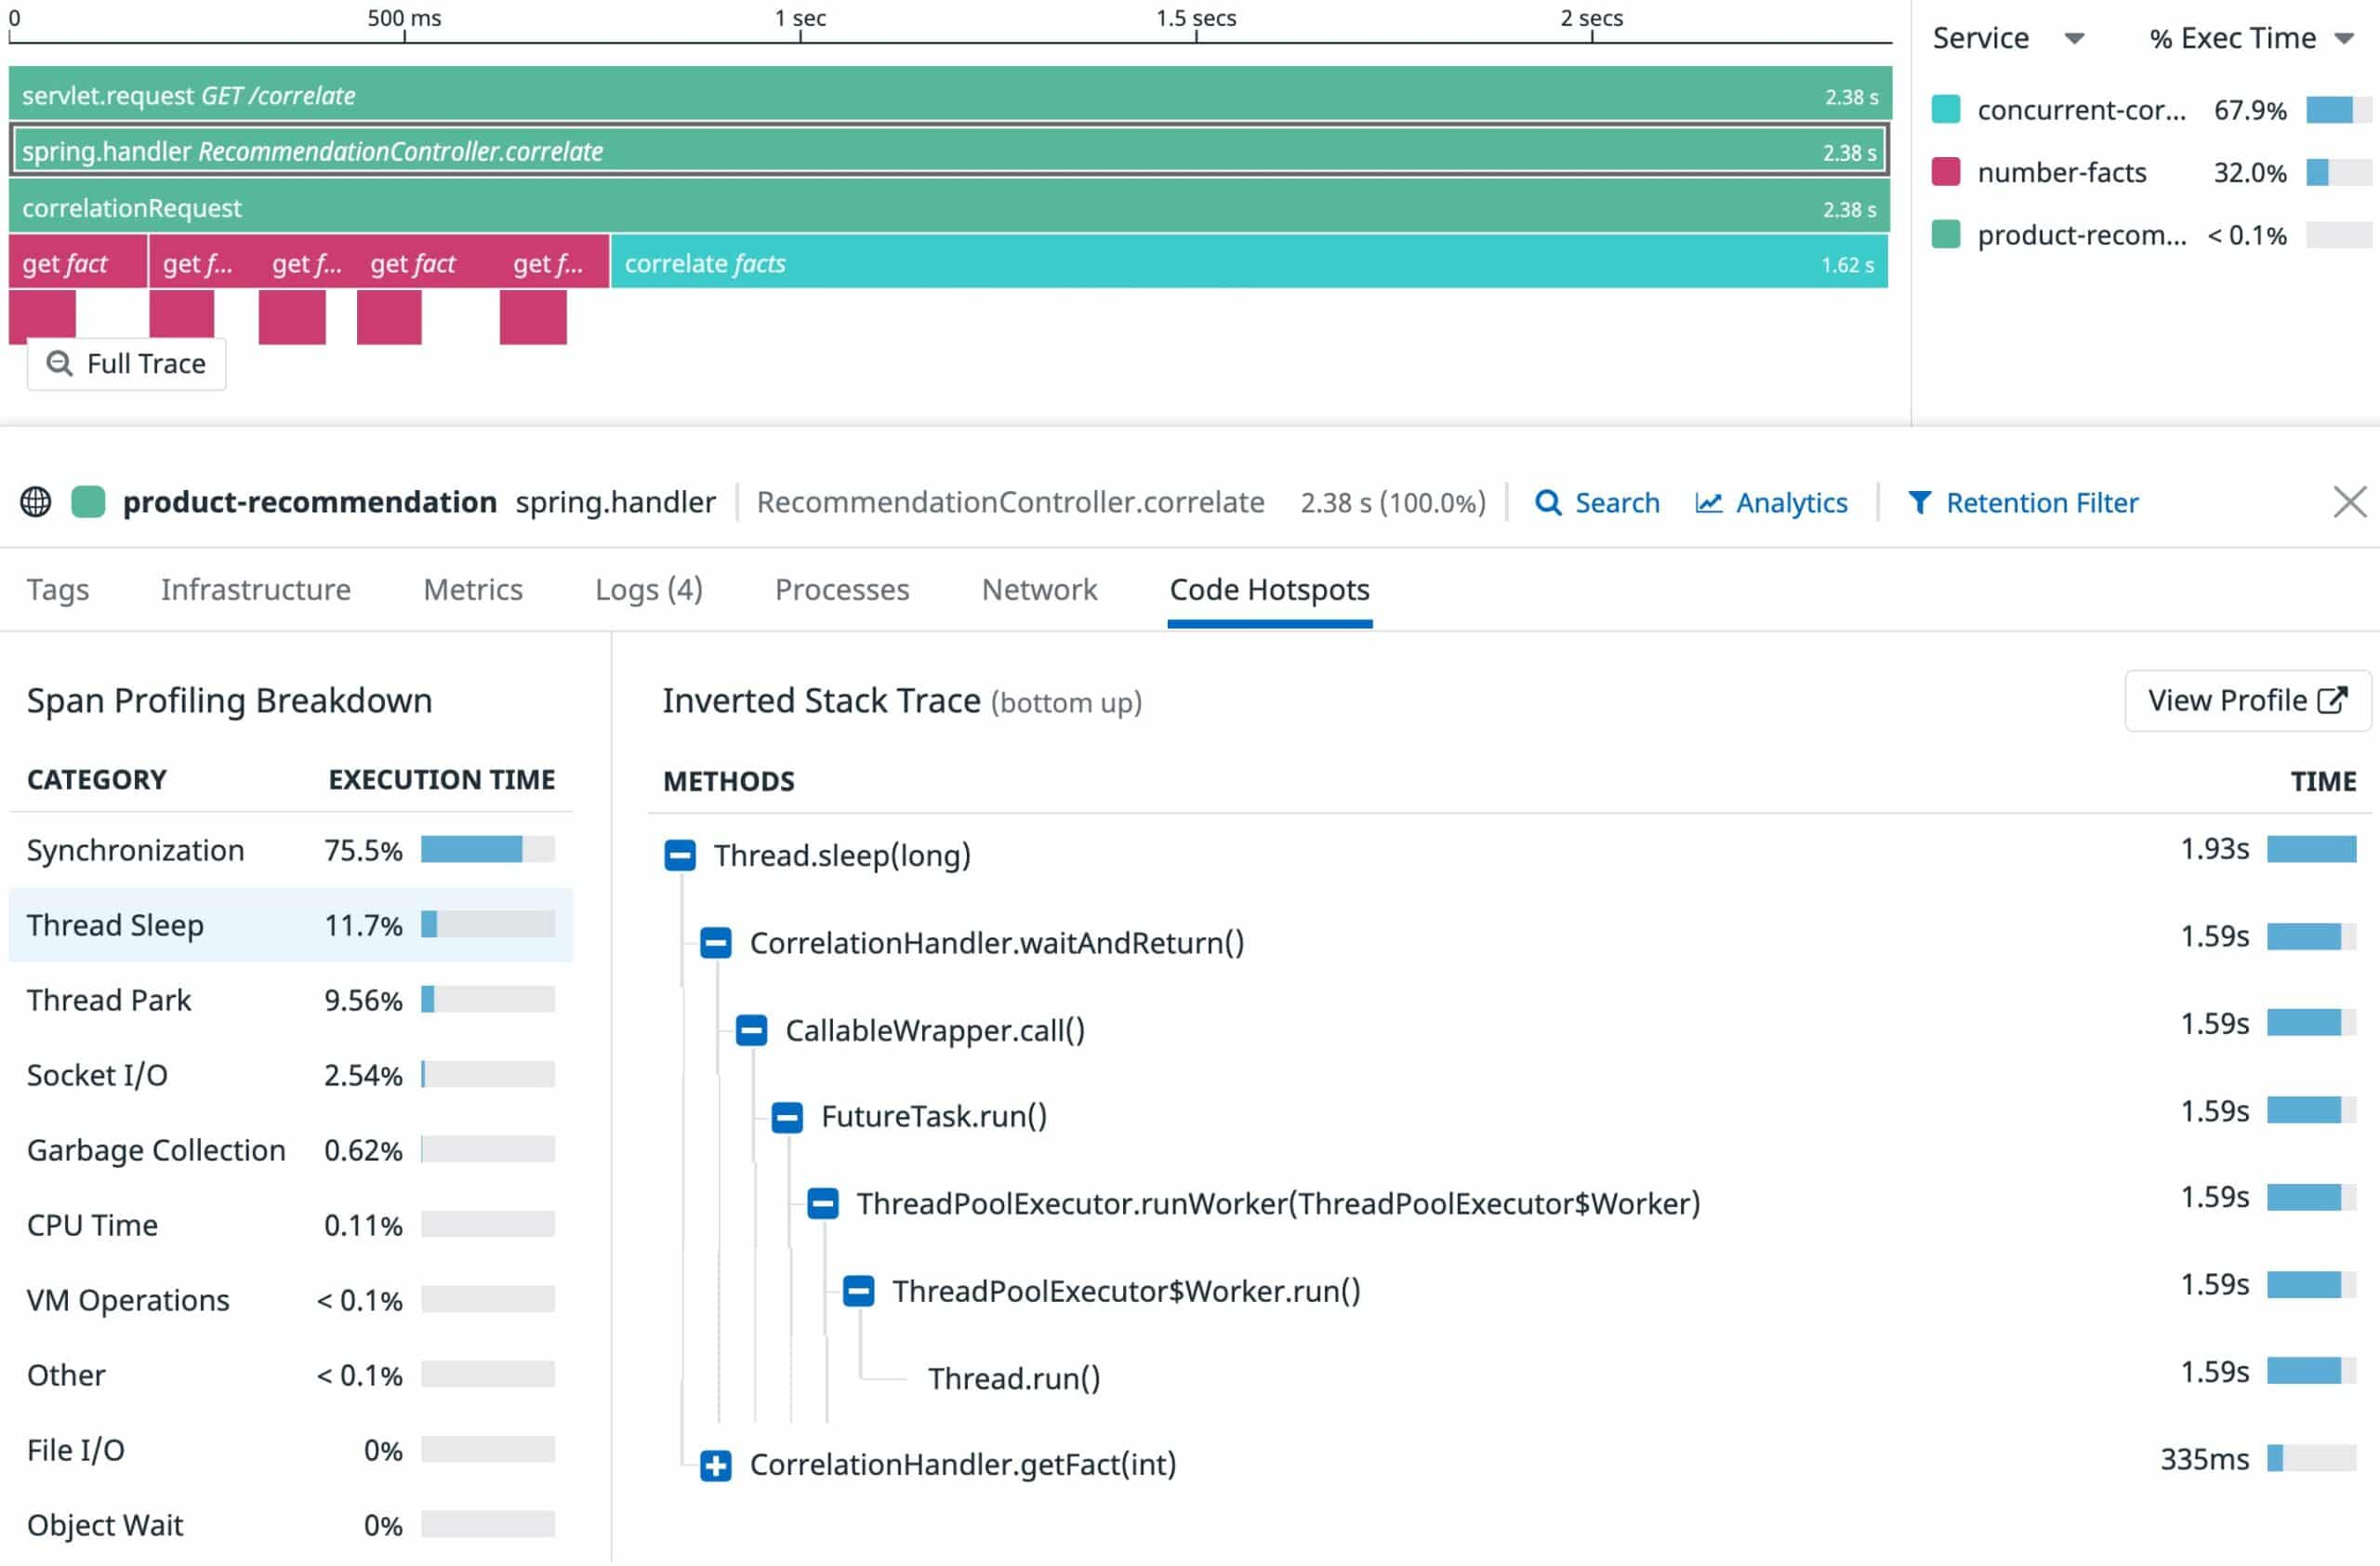
With real-time insight into all ingested traces and service dependencies over the previous 15 minutes, issues may be identified more quickly and accurately. You can also use always-on, low-overhead code profiling to improve your production code and reduce compute expenses and minimize causes of delays by breaking down sluggish requests by the amount of time spent in code on the CPU, GC, lock contention, and I/O.
In terms of visuals, you can utilize the Service Map to visualize changes in service dependencies caused by deployments, and identify anomalies in error and latency with pre-built service dashboards. By contrasting code profiles using any tag and timeframe, you can explain performance regressions brought on by wasteful code—or by tracking profile aggregations of services and endpoints and looking for bottlenecks in your code, you may increase application performance.
As mentioned, there is a substantial number of pre-packaged and immediately deployable integrations, including Java, .NET, PHP, Node.js, Ruby, Python, Go, or C++ projects, using hundreds of integrations with third-party frameworks or libraries. You can also access flexible support for standards like OpenTelemetry and OpenTracing that are vendor-neutral.
Who is it recommended for?
Datadog APM is ideal for development and QA teams that work on testing app performance and efficiency. Based on actual user interactions, it finds the most popular yet untested online actions, assisting teams in developing pertinent tests to close coverage gaps. Datadog swiftly develops relevant tests through an easy-to-use chat user interface (UI) and uses AI-generated synthetics to identify important business flows. This ensures strong browser testing and better application stability by increasing testing speed and comprehensiveness.
Pros:
- Vulnerability Detection: Reduces security risks by checking the datadog score and understanding the vulnerability factors and live threat activity.
- Reduce negative impact: Checks for faulty deployment action to minimize downtime and ensure smooth signals.
- Secure Cloud Apps: Secures on-premise and cloud apps and finds weaker points that result in low and poor app performance.
- Intelligent Test Runner: Analyzes and captures errors, stack traces, GIT information, and more to fix testing issues.
Cons:
- Code Customization: Many users reported that APM requires code customization, and it also has a complex ingestion and retention process, which might make the tool use difficult and unproductive.
Datadog provides a full 14-day free trial to test the app integration and see how well it functions with your infrastructure. The capabilities of the Pro version can be improved with the addition of data forecasting, which enables you to make predictions, and AI-driven alerting, which may be beneficial depending on the scale of your infrastructure and the demands made on your application servers.