We may earn a commission if you make a purchase through the links on our website.
The Best CPU Temperature Monitors
UPDATED: October 13, 2022
CPU temperature monitoring is a contentious issue because different processors have different operating temperature ranges. So, recording the temperature of your processor isn’t enough. You also need to know what is considered a safe temperature for that particular make and model. Adding to the confusion, there are different expectations for each processor type, depending on the amount of load on it. Furthermore, a CPU contains several cores and each of those has an individual temperature to record.
When you are looking for a CPU temperature monitor, you should focus on those systems that set performance thresholds and will notify you if the CPU temperature goes above that level. A well-calibrated CPU temperature monitor that can adjust its warning thresholds according to the processor model will save you the time of having to attend to false alarms.
Here is our list of the best CPU temperature monitors:
- Site24x7 – FREE TRIAL A collection of system monitoring tools that includes CPU monitoring in its network monitoring for network devices and for servers in its Server monitoring module. This is a cloud-based system. Start a 30-day free trial.
- ManageEngine OpManager – FREE TRIAL This monitoring package covers servers and network devices and it can check on the temperature of each of those pieces of equipment. It installs on Windows Server and Linux and can monitor other servers apart from the host by reaching across the network. Download a 30-day free trial.
- Datadog This tool is able to monitor CPU temperature on a range of devices, including IoT equipment. This is a cloud-based service.
- Atera A cloud-based package of support software for managed service providers that includes hardware monitoring, such as CPU temperature checks.
- SolarWinds Server & Application Monitor An excellent application monitor that has extensive server hardware checks that include CPU temperature monitoring. Installs on Windows Server but can monitor other servers across a network, including those running Linux.
- Nagios XI This monitoring system can be extended by free plugins and there are a number of these that include CPU temperature monitoring capabilities. It installs on Linux or on Windows Server over a hypervisor.
- SpeedFan This handy free tool covers a number of hardware statuses including fan speed and CPU temperature. Use it to feed data into your system monitor. It installs on Windows.
Although many IT managers practice a “best of breed” policy when buying monitoring software, getting a specialist monitoring tool to just track CPU temperature is probably going a little too far down that path. A better idea is a monitor that will track several indicators of CPU health simultaneously. For example, as has already been mentioned, it is a good idea to track the fan performance alongside CPU temperature.
Another good combination of factors to monitor alongside CPU temperatures is the number of active processes together with total processing demand. If you can get a CPU monitor that shows a range of factors all on one screen it is a lot easier to get a quick visual tip on what is going wrong.
Clearly, monitors that have graphical interpretations of CPU statistics are much easier to comprehend than those that show metrics as numbers. Color-coded dials are even better. With these recommendations in mind, we have looked for the best options of CPU monitor among tools that excel at server resource monitoring.
What is the maximum temperature on a processor?
Processors have their own on-board thermometers and they will start to take evasive action once the temperature gets too high. This level is actually very high and is usually a lot higher than the expected temperature for normal operations.
Intel calls the temperature level that will trigger action the TJunction, which is also called TJ Max. When a CPU’s temperature hits the TJunction, the processor triggers its thermal control system. It doesn’t shut down. Instead, it lowers the frequency of its actions, which means it slows down. It will also throttle the power running into the chip. However, a lower operating frequency places lower demand on the power supply, so those two actions are two sides of the same coin.
There is a gap between what is considered normal temperature and the level that the CPU will start to shut down. For example, on an Intel i7 processor, the normal temperature during full load is between 50 and 65 degrees Celsius but its TJ Max is 100 degrees Celsius. That creates a gray area because regularly running at high temperatures below TJ Max can cause long-term physical damage incrementally.
Short spikes in temperature shouldn’t do too much damage. However, if the temperature frequently runs higher than expected, while also keeping below TJ Max, elements within the processor can be damaged, possibly causing deterioration in the connections between them. Those damaged connections could result in more overheating and possibly arcing, leading to a loss of bits in the traffic within the processor and emergency shutdowns.
So, if your CPU runs at a high temperature for a long time, you could later find it shutting down for no apparent reason even during periods when it is not running hot. Basically, at that point, the processor is effectively ruined and needs to be replaced.
Monitoring CPU temperature
The processor will take care of spotting its TJunction temperature. However, you don’t want matters to get to that point. You also don’t want the temperature to run above the recommended levels into that gray area too often.
It is also a good idea to twin CPU temperature monitoring with server or rack fan speed monitoring. It could be that your CPU has started to heat up because the fan is not identifying high temperatures properly or has completely broken down. So, monitoring the fan provides you with an immediate answer should your CPU temperature rise. If your fan is working fine and the CPU overheats, then you have a bigger problem to work on.
Our methodology for selecting the best CPU temperature monitors:
We've broken down our analysis for you based on these key criteria:
- Scope of Monitoring: We prioritize tools that provide comprehensive monitoring capabilities, not just CPU temperatures, to give a holistic view of system health.
- Ease of Use: Tools should be straightforward to install and manage, with intuitive interfaces that simplify the monitoring process for users of all skill levels.
- Customization and Scalability: Monitors that offer customizable alerts and the ability to scale with growing system demands score higher on our list.
- Support and Community: The availability of professional support and an active community for troubleshooting and plugin development is essential.
- Integration Capabilities: We look for tools that can seamlessly integrate with other system monitoring software, enhancing overall functionality.
The Best CPU Temperature Monitors
1. Site24x7 – FREE TRIAL
Site24x7 is a cloud-based service that includes network, server, and application monitors. The types of monitors you get depend on the package that you choose. Each plan is tailored towards a particular category of IT resources, such as websites, applications, and infrastructure. However, network and server monitoring are included in all of these packages.
Key Features:
- SNMP & WMI Monitoring: Enables thorough tracking of network and server conditions via SNMP and WMI protocols.
- Holistic Dashboards: View comprehensive monitoring data across network, server, and applications from a unified interface.
- Machine Learning Thresholds: Automatic adjustments of performance thresholds using machine learning to prompt timely alerts.
- Real-Time Discovery: Instantly detects and maps new devices, updating network topology and inventory automatically.
- Multi-Category Monitoring: Tailored monitoring solutions across various IT categories, ensuring extensive coverage.
Why do we recommend it?
Site24x7 stands out for its comprehensive monitoring capabilities that span across network, server, and application performance, all accessible from a cloud-based, single dashboard. Its use of machine learning to adjust performance thresholds provides a proactive approach to IT management.
The network monitoring feature of Site24x7 includes the collection and display of data circulated through the Simple Network Monitoring Protocol (SNMP). The SNMP service provides a lot of information on network device statuses and activities and CPU temperature is one of the factors reported in this format.
Not every device fills out the CPU temperature field. In those cases, you can get an idea of CPU safety by looking at the CPU capacity and load instead.
Server CPU temperatures can be measured in two ways – either through SNMP or, for Windows versions, through the WMI system.
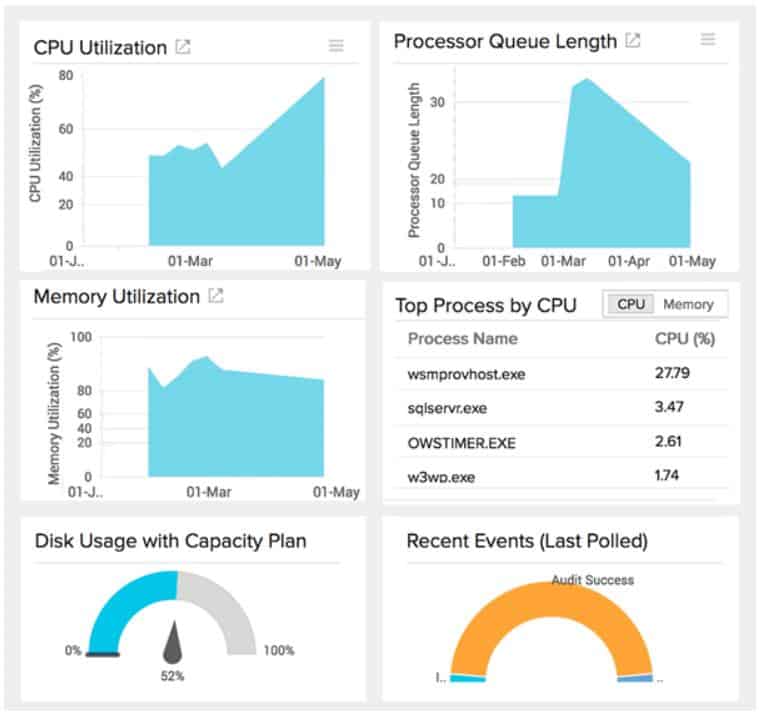
While giving you information on server and network device statuses, such as CPU temperature, the Site24x7 system provides insights into many other IT resource activity. All of this system monitoring information is available in a single browser-based dashboard. The system also includes performance thresholds that are automatically adjusted through a machine learning technique. When those thresholds are crossed. Site24x7 raises an alert.
Who is it recommended for?
This tool is ideal for IT administrators and operations teams who need a robust, all-in-one solution to monitor and manage diverse IT environments, from network hardware to user interactions and application performance.
Pros:
- Comprehensive Coverage: Supports extensive monitoring of networks, servers, and user interactions within one platform.
- Dynamic Configuration: Utilizes real-time data for device discovery and network mapping, enhancing operational efficiency.
- User-Friendly Interface: Offers an intuitive, easy-to-navigate dashboard, reducing the learning curve for new users.
- Insightful User Monitoring: Bridges the gap between technical performance and user behavior, aiding in strategic business decisions.
Cons:
- Complexity: The platform's detailed and comprehensive nature necessitates a substantial time investment to master.
Site24x7 includes CPU temperature monitoring with complete system-wide performance tracking. Get a 30-day free trial.
2. ManageEngine OpManager – FREE TRIAL
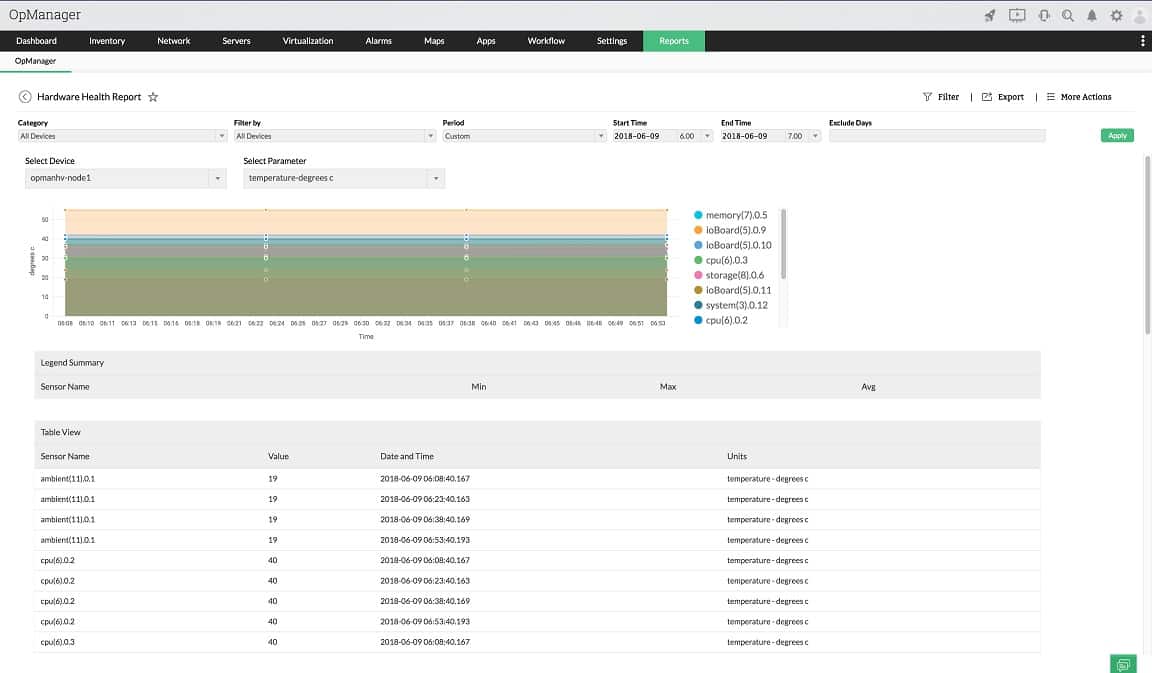
ManageEngine OpManager is a good choice for those who are specifically looking for a system to check hardware statuses on all devices because it covers networks and servers. The network monitoring features of this service focus on network device performance. This is strongly based on SNMP information and that feedback includes live reports on device CPU temperature. The server monitoring section of OpManager also reports on CPU temperature.
Key Features:
- Comprehensive Device Monitoring: Monitors hardware status across networks and servers, focusing on SNMP-based device performance.
- Real-Time Activity Tracking: Displays live network activity and server resource usage, enhancing operational efficiency.
- Customizable Dashboards: Offers over 200 widgets for tailored reporting and dashboard creation.
- Intelligent Alerting: Minimizes false positives and alert fatigue with smart alert configurations.
- Multi-Channel Alerts: Supports diverse alerting channels including email, SMS, and webhooks.
Why do we recommend it?
ManageEngine OpManager is highly effective for IT professionals who need a detailed and responsive monitoring solution, equipped with extensive customization options and intelligent alerting to streamline network management tasks.
OpManager isn’t exclusively a hardware monitor. It also keeps track of the activities of those devices. For example, it will show you live activity on your network, and for servers, you will see all of the resource usages as it happens. This is great for operations technicians because they don’t have to switch between applications in order to carry out all of their system monitoring duties.
Who is it recommended for?
This tool is ideal for network administrators and operations technicians who need a comprehensive view of their network and server performance in real time, especially in environments where minimizing downtime and maintaining high service levels are critical.
Pros:
- Plug-and-Play Setup: Ready to use with extensive customization options through widgets.
- Advanced Traffic Management: Incorporates traffic management and DPI tools for detailed network control.
- Smart Alerts: Intelligent alerting system designed to reduce unnecessary notifications.
- Versatile Notification System: Provides multiple alerting channels for comprehensive coverage.
- SLA Configuration: Enables setting up specific service level agreements for network, applications, or processes.
Cons:
- Steep Learning Curve: Feature-dense interface requires considerable time to master.
The system includes performance thresholds that trigger alerts if crossed and those alerts can be sent out as notifications by SMS or email. The software for ManageEngine OpManager installs on Windows Server or Linux and you can get a 30-day free trial.
3. Datadog
Datadog is a cloud-based system that includes monitors for servers and networks. There are also monitors for application and website performance.
Key Features:
- Cloud-Based Monitoring: Seamlessly monitors cloud, local, and IoT devices from a unified platform.
- Comprehensive Coverage: Extends monitoring capabilities to remote sites and wireless network APs.
- Custom Metrics: Allows customization of metrics, including CPU temperature monitoring.
- Real-Time Updates: Reflects changes in the network and system performance almost instantly.
- Intelligent Alerts: Utilizes machine learning to set performance thresholds and send proactive alerts.
Why do we recommend it?
Datadog excels in providing a versatile, cloud-based monitoring solution that integrates seamlessly across various platforms and devices, enhancing operational visibility and responsiveness without the overhead of physical infrastructure.
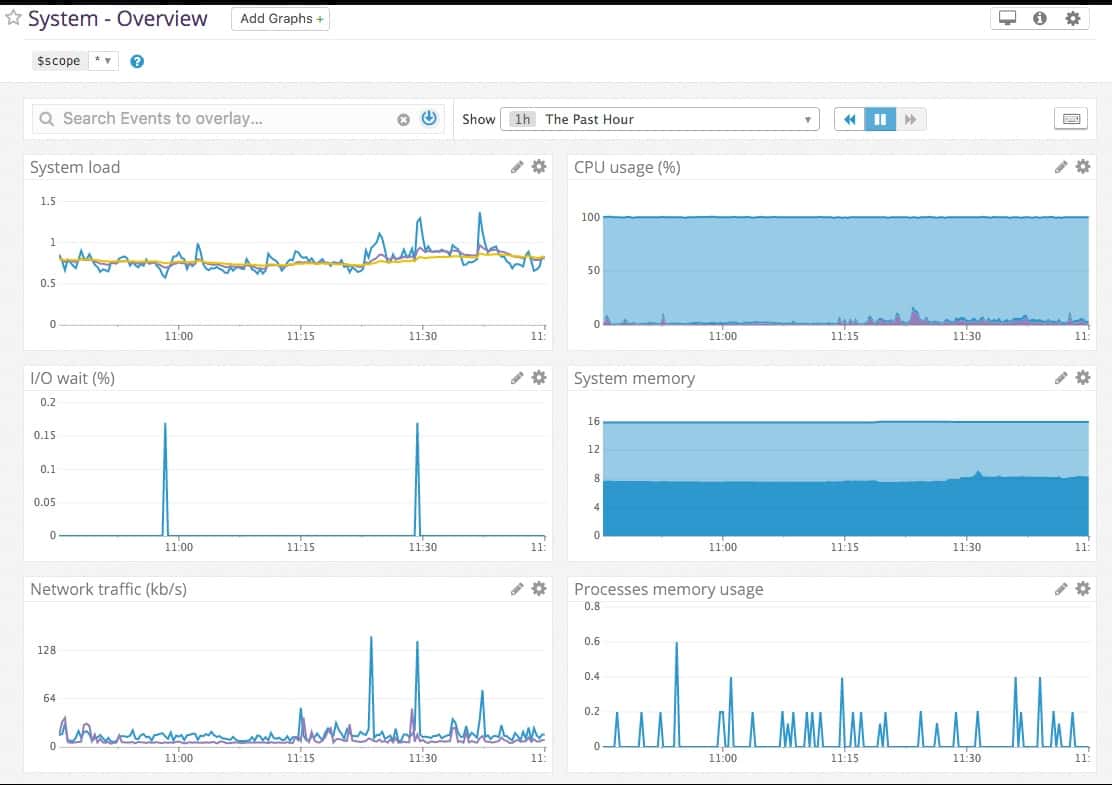
The server and network monitors in Datadog are able to reach out to cloud resources across the internet as well as check on servers and network devices locally. The system has the capability to include remote sites in the monitoring service as well. Another useful capability in Datadog is the tracking of IoT devices and wireless network APs.
The Datadog system will monitor CPU temperature data where it is made available through WMI or SNMP. Many IoT device status messaging systems also include CPU temperature data. With Datadog, it is also possible to customize metrics tracking through the backend to add CPU temperature monitoring.
Who is it recommended for?
This tool is particularly useful for network administrators and IT professionals who require a detailed, real-time overview of both local and remote environments. It's well-suited for dynamic and growing businesses seeking a scalable, cloud-based monitoring system.
Pros:
- User-Friendly Dashboards: Features easily customizable dashboards for varied monitoring needs.
- SaaS Convenience: Offers cloud-based operations eliminating the need for local server setup.
- Holistic Monitoring: Provides a comprehensive view of both internal and external network performances.
- Dynamic Mapping: Employs auto-discovery to continuously update network topology maps.
- Scalable Solutions: Flexible pricing options make it easy to scale monitoring efforts as business grows.
- Responsive Updates: Network modifications are updated in the system in near real-time.
Cons:
- Limited Trial: The trial period could be extended to allow more thorough testing.
The Datadog interface includes alerts with performance thresholds that are based on machine learning baselines. This system will send out alerts as notifications via email or collaboration system, such as Pagerduty or Slack. You can access a 14-day free trial.
4. Atera
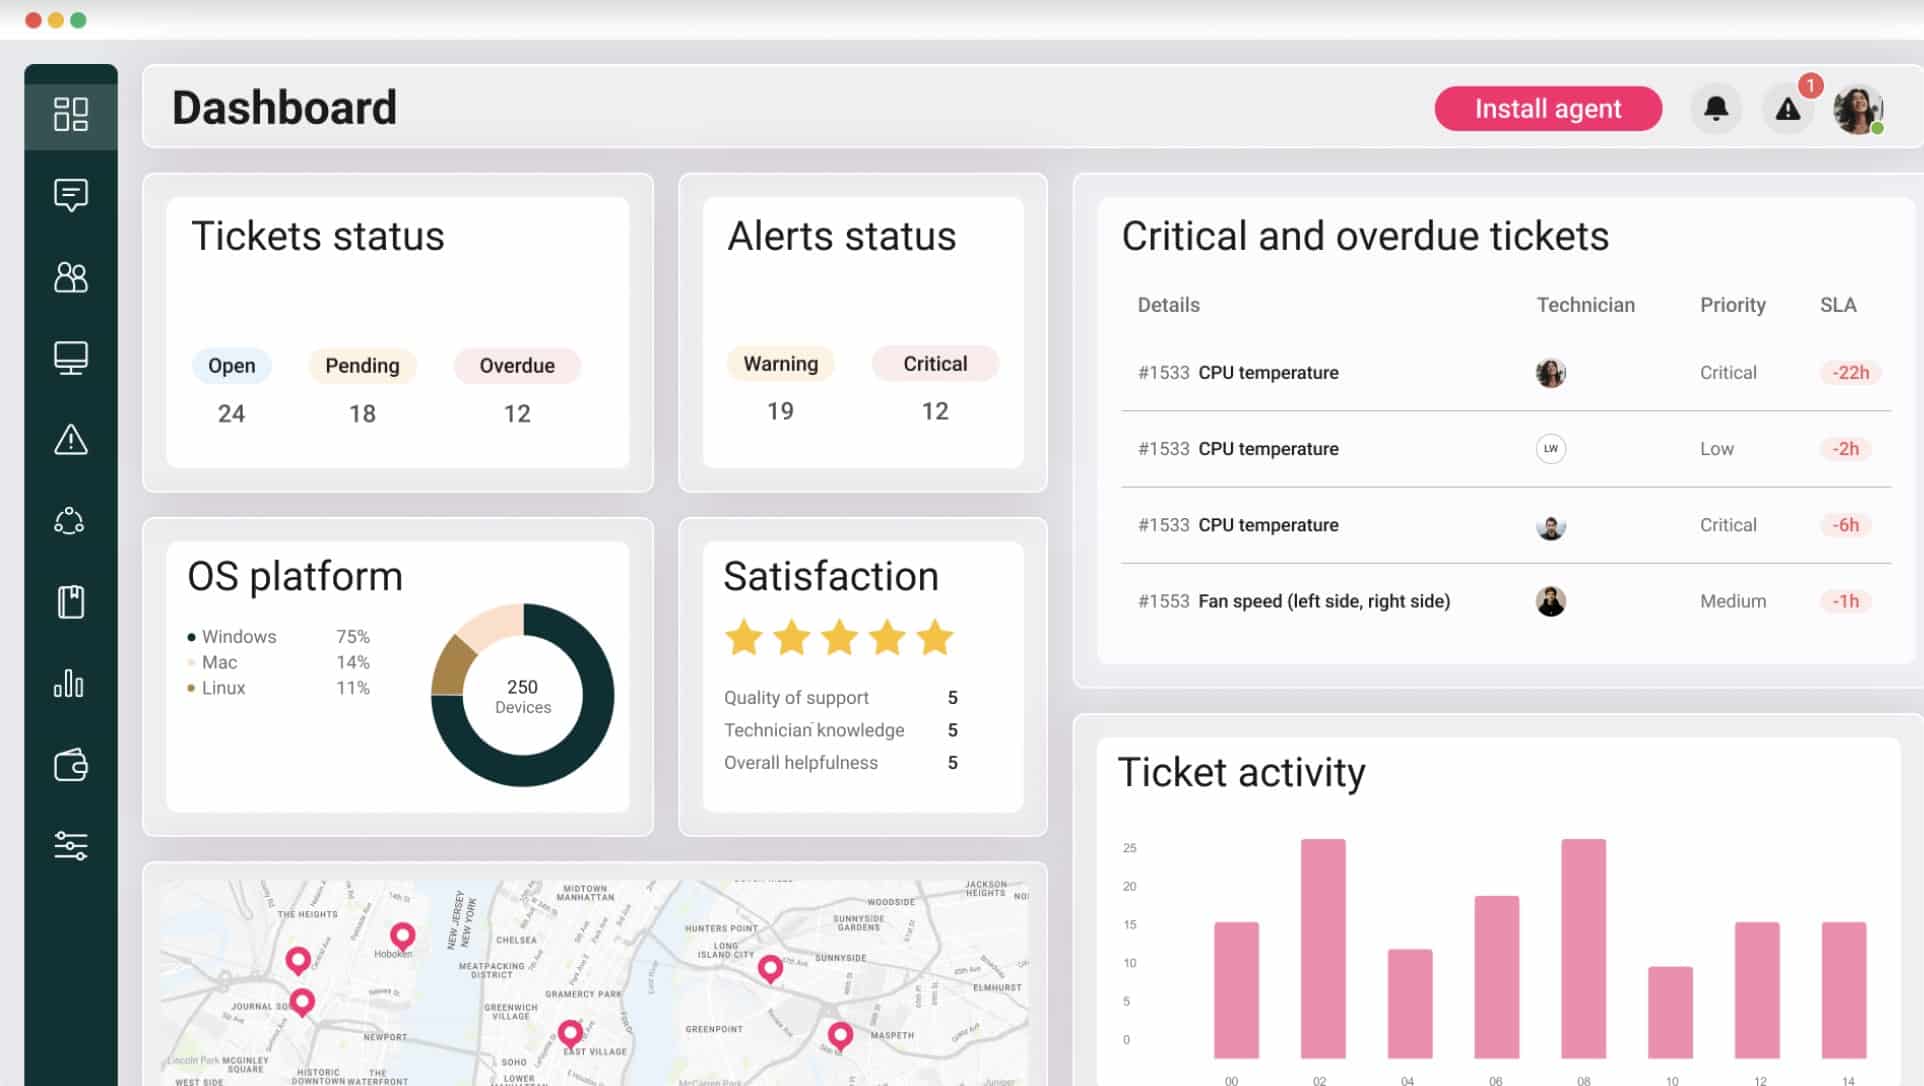
Atera is a complete package for Managed Service Providers (MSPs). It includes all of the software that an MSP needs to run the business – that is called Professional Services Automation (PSA). It also has all of the tools that technicians in the MSP need to perform their duties – that bundle is called a Remote Monitoring and Management package (RMM).
Key Features:
- Integrated PSA and RMM: Combines Professional Services Automation and Remote Monitoring Management in one package.
- Comprehensive Dashboard: Displays CPU temperature and other critical server metrics for easy monitoring.
- Flexible Licensing: Pricing model based on per technician, making it adaptable for various business sizes.
- Cloud-Based Infrastructure: Includes necessary servers and storage within the service package.
- SLA and Time Tracking: Features tools for managing service level agreements and tracking maintenance tasks.
Why do we recommend it?
Atera stands out as a robust solution for Managed Service Providers, offering an all-in-one platform that combines essential PSA and RMM tools with a cloud-based infrastructure, making it ideal for efficient and scalable operations.
Among the RMM tools are systems to monitor hardware statuses and one of the metrics that the service collects is CPU temperature. That temperature data is shown in a dashboard screen alongside many other server statuses, so it is easy to cross-reference factors such as CPU load to see whether they have an influence on the temperature of the processor.
Who is it recommended for?
This tool is especially valuable for MSPs of varying sizes—from solo technicians to larger firms—looking to streamline their service delivery with a comprehensive set of management and monitoring tools. It’s particularly beneficial for businesses seeking to minimize infrastructure overhead while maintaining flexibility in service offerings.
Pros:
- Streamlined Interface: Minimalistic design facilitates easy access to important metrics.
- Cost-Effective Pricing: Offers a flexible pricing model suitable for small to mid-sized businesses.
- Extensive PSA Tools: Equipped with numerous features beneficial for helpdesk operations and MSP growth.
- Scalable Service Model: Allows easy addition or removal of technician seats to match business demands.
- Integrated SLA Tracking: Supports tracking of service level commitments and time management for tasks.
Cons:
- Limited for Small Teams: Some MSP-specific functionalities may not be fully usable by smaller organizations.
A great benefit of the Atera hosted system is that it includes the server that runs the software and storage space in with the package. Prices are set per technician so a freelance individual setting up a support service gets all of the tools that big businesses get. Larger MSPs can pitch for work knowing that seats are easy to add and remove, which cuts down on the worry of overhead. Get access to all of Atera’s features on a 30-day free trial.
5. SolarWinds Server & Application Monitor
SolarWinds Server & Application Monitor is highly rated for supervising application performance. However, it is also a really excellent server monitor.
Key Features:
- Multi-Platform Monitoring: Supervises performance across various server types, including Linux and Unix.
- Intuitive Dashboard: Organized and versatile for monitoring multiple statistics via a tabbed interface.
- Customizable Alerts: Allows setting and modification of performance thresholds for proactive management.
Why do we recommend it?
SolarWinds Server & Application Monitor is an exemplary tool for complex and large-scale IT environments, offering deep insights and comprehensive management capabilities that simplify network administration.
The software for this package installs on Windows Server but the monitor doesn’t just track the performance of the server that hosts it. It can supervise the performance of other servers across the network and that includes servers running Linux and various flavors of Unix.
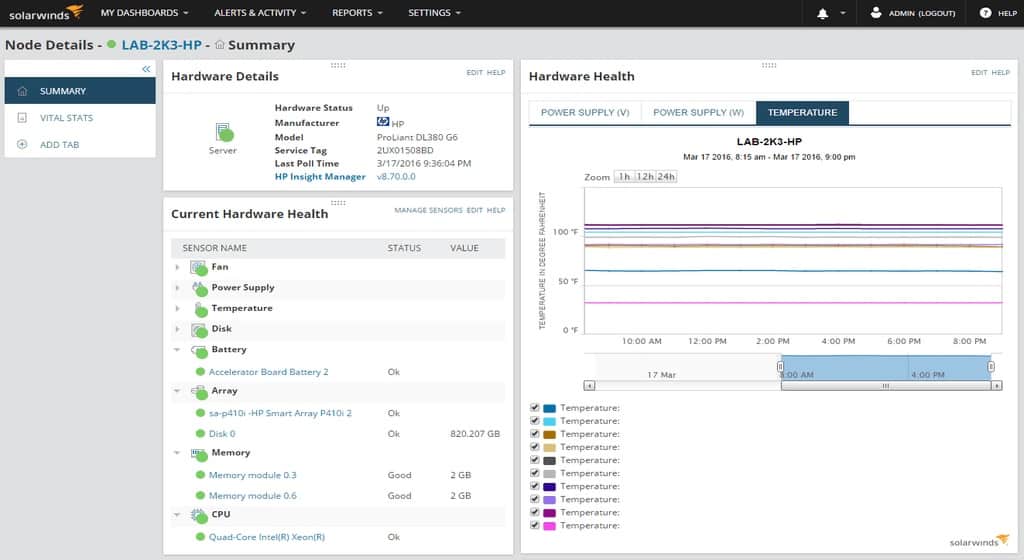
The hardware monitoring screen of the Server & Application Monitor dashboard is well organized even though it crams access to a lot of different statistics into a small space. A small file hierarchy panel on the left of the screen allows you to select metrics to show in a graph panel on the right of the screen. You can select several metrics and then switch between their graphs of live performance data through a tabbed interface.
The live statistics are shown in a time series and you can adjust the time frame to get greater detail or a longer timeline. The screens give you a lot of different stats and all can be shown as color-coded charts and graphs. This makes rapid problem correlation really easy to perform manually. There are also screens that show both application and server statistics side by side.
There is an alerting system built into the monitor that you are allowed to customize. Each monitored metric, such as CPU temperature has a performance threshold on it. These levels can be adjusted and it is also possible to create combined alerts from several different live statistic monitors.
Who is it recommended for?
This tool is best suited for IT professionals and administrators in large enterprises or organizations that require robust, scalable solutions for monitoring a diverse array of devices and systems across their networks.
Pros:
- Enterprise-Ready: Tailored for large network environments with comprehensive management tools.
- Automated Mapping: Real-time auto-discovery for network topology and inventory simplification.
- Superior Alerting: Highly effective and user-friendly alert customization options.
- Versatile Monitoring: Supports extensive monitoring capabilities through SNMP and packet analysis.
- Customizable Interface: Enables personalization of the dashboard with drag-and-drop widgets.
- Comprehensive Reports: Includes a robust reporting framework with ready-to-use compliance templates.
Cons:
- Complex Interface: Geared towards IT experts, requiring a learning curve to leverage all features fully.
SolarWinds Server & Application Monitor is available for testing through a fully functional 30-day free trial.
6. Nagios XI
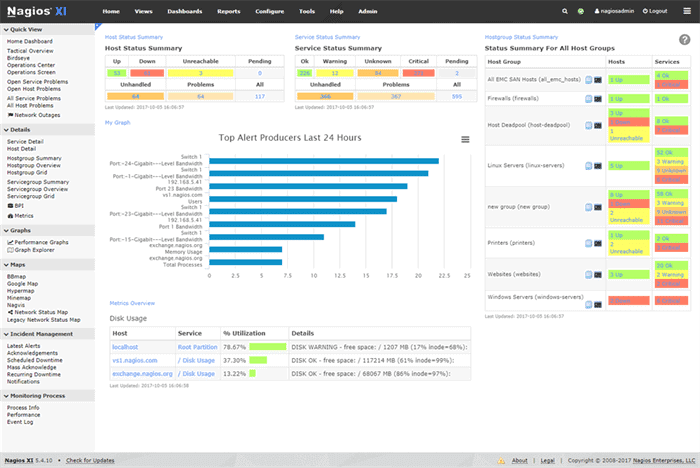
Nagios XI is a package of network, server, and application monitors. This excellent package has a lot of fans and its user community is very active. Buyers of the Nagios XI system get the professional edition of the software. However, there is also a free version, called Nagios Core.
Key Features:
- Extensive Plugin Library: Offers thousands of community-created plugins for customized monitoring.
- Cross-Platform Support: Runs on Linux, with options for virtualization on Windows servers.
- Professional vs. Community Editions: Provides both a feature-rich paid version and a free, community-supported variant.
- Flexible Alerts: Supports a variety of alerting options, including SMS and email.
- Active User Community: Benefits from a highly active community offering support and plugins.
Why do we recommend it?
Nagios XI is renowned for its robust monitoring capabilities and flexible integration options, supported by a vast library of free plugins and a strong user community. Its professional edition further enhances these features with dedicated support, making it a reliable choice for serious monitoring needs.
You might wonder why you should bother to pay for Nagios XI when Nagios Core has just about all of the same features – Nagios XI is based on Nagios Core. There is one big difference, which is that Nagios Core is community supported whereas Nagios XI comes with a professional support package.
Not only does the user community contribute enthusiastically to a Nagios message board system but they also produce thousands and thousands of free plugins. Many software producers also create free plugins for Nagios to make it easier to monitor their products with the system. Among the enormous list of plugins are a number that add on the ability to monitor CPU temperature on servers and on network devices.
Who is it recommended for?
Ideal for IT professionals and organizations that require a customizable, scalable monitoring solution. Nagios XI is particularly beneficial for those who value community-driven enhancements and can benefit from the extensive plugin system to tailor the tool to their specific needs.
Pros:
- Intuitive Interface: Simple yet detailed enough to provide key monitoring information.
- Versatile Alerting System: Enables alert configurations via SMS and email for immediate notifications.
- Rich Plugin Ecosystem: Access to a broad range of free plugins, enhancing functionality and customization.
Cons:
- Limited Support in Free Version: Nagios Core lacks the professional support available in Nagios XI.
The plugin facility of Nagios is its unique selling point and many other monitoring tools are actually forks of Nagios. The great thing about all of those other tools that are copied from Nagios is that all of the Nagios plugins work with them as well. Both Nagios XI and Nagios Core run on Linux. You can run them on a Windows server on top of a VMWare or Hyper-V hypervisor. You can get Nagios Core for free or get a 30-day free trial of Nagios XI.
7. SpeedFan
In this review, we have focused on systems that include CPU temperature checks in with a lot of other monitoring capabilities so that you don’t get stuck opening one small application just to see CPU temperature and little else. SpeedFan is one of those little specialized applications that we were trying to avoid.
However, there is a very good reason that we included it. There are a number of very good free PC system monitor tools that don’t include CPU temperature checks that are still worth a try. Icinga 2 and Zabbix are just two examples of this category. In these cases, you can easily add in your own custom metrics and the service will create a display for them. All you need is a sensor to gather a live temperature status feed. SpeedFan can be used for this purpose.
Key Features:
- Specialized Monitoring: Targets specific system metrics like CPU temperature and fan status.
- Immediate Metrics Collection: Begins gathering and displaying system data promptly after installation.
- Smart Data Analysis: Captures and analyzes S.M.A.R.T data alongside other critical system metrics.
- Fan Speed Management: Helps correlate fan speeds with temperature changes for optimal performance.
Why do we recommend it?
SpeedFan is a valuable tool for users needing a straightforward, effective solution to monitor individual system metrics, particularly temperature and fan operation, without the complexity of network-wide systems.
Who is it recommended for?
This tool is recommended for individual users, IT students, or hobbyists who need to manage and monitor their personal computer’s thermal and operational metrics closely. It’s particularly useful for those who want to enhance their understanding of how internal temperatures affect PC performance.
Pros:
- Quick Setup: Simple installation process that quickly starts monitoring system metrics.
- Dedicated Monitoring: Designed for individual PC monitoring with an intuitive interface.
- Comprehensive Data Tracking: Collects extensive details on fan status and system health.
- Temperature Management: Aids in managing and understanding the impact of temperature on system performance.
Cons:
- Network Limitations: Primarily suitable for single-machine monitoring, not for larger network environments.
- Basic Reporting: Lacks advanced reporting and long-term data monitoring capabilities.
If you don’t want to set up your own customized CPU temperature feed for some other system, then SpeedFan is a very good standalone system to try. It only runs on Windows and Windows Server. You can download SpeedFan for free.