We may earn a commission if you make a purchase through the links on our website.
The Best Network Monitoring Tools
UPDATED: September 10, 2026

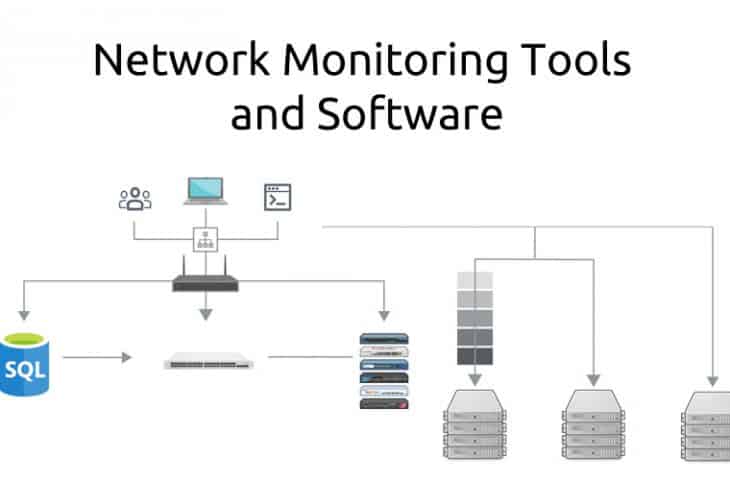
The realm of Network Monitoring Tools, Software, and Vendors is Huge, to say the least. New software, tools, and utilities are being launched almost every year to compete in an ever-changing marketplace of IT monitoring, server monitoring, and system monitoring software.
Here is our list of the top ten network monitoring tools:





- Checkmk – Best for hybrid monitoring with a free option for small businesses.
- Progress WhatsUp Gold – Best for Windows teams needing discovery, maps, and traffic analysis.
- AdRem NetCrunch – Best for mid-to-large teams wanting agentless multi-vendor monitoring.
- ManageEngine OpManager – Best for Windows and Linux teams needing SNMP monitoring and maps.
- NinjaOne – Best for MSPs needing cloud network and endpoint management.
- Site24x7 – Best for businesses wanting affordable cloud full-stack monitoring.
- ManageEngine RMM Central – Best for sysadmins needing automated discovery with remote access.
I’ve test-driven, played with and implemented dozens during my career and this guide rounds up the best ones in an easy-to-read format and highlighted their main strengths and why I think they are in the top class of tools to use in your IT infrastructure and business.
Some of the features I am looking for are device discovery, uptime/downtime indicators, along with robust and thorough alerting systems (via email/SMS), NetFlow and SNMP Integration as well as considerations that are important with any software purchase such as ease of use and value for money.
The features from above were all major points of interest when evaluating software suites for this article and I’ll try to keep this article as updated as possible with new feature sets and improvements as they are released.
Related Post: Best Bandwidth Monitoring Software and Tools for Network Traffic Usage
The Top Network Monitoring Tools
Below you’ll find an updated list of the Latest Tools & Software to ensure your network is continuously tracked and monitored at all times of the day to ensure the highest up-times possible. Most of them have free Downloads or Trials to get you started for 15 to 30 days to ensure it meets your requirements.
What should you look for in network monitoring tools?
We reviewed the market for network monitoring software and analyzed the tools based on the following criteria:
- An automated service that can perform network monitoring unattended
- A device discovery routine that automatically creates an asset inventory
- A network mapping service that shows live statuses of all devices
- Alerts for when problems arise
- The ability to communicate with network devices through SNMP
- A free trial or a demo for a no-cost assessment
- Value for money in a package that provides monitoring for all network devices at a reasonable price
With these selection criteria in mind, we have defined a shortlist of suitable network monitoring tools for all operating systems.
1. Auvik – FREE TRIAL
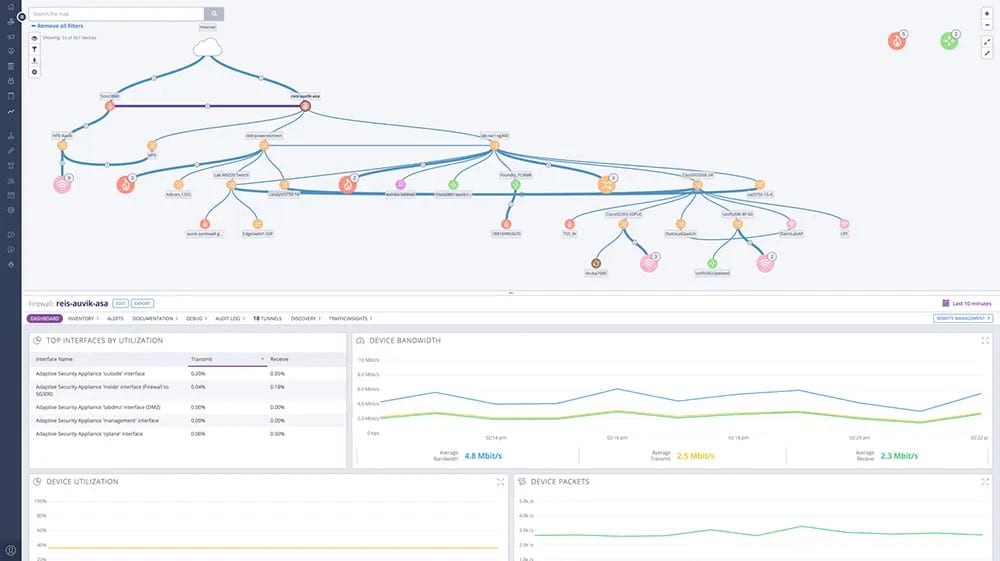
Auvik is a SaaS platform that offers a network discovery and mapping system that automates enrolment and then continues to operate in order to spot changes in network infrastructure. This system is able to centralize and unify the monitoring of multiple sites.
Key Features:
- A SaaS package that includes processing power and storage space for system logs as well as the monitoring software
- Centralizes the monitoring of networks on multiple sites
- Watches over network device statuses
- Offers two plans: Essential and Performance
- Network traffic analysis included in the higher plan
- Monitors virtual LANs as well as physical networks
- Autodiscovery service
- Network mapping
- Alerts for automated monitoring
- Integrations with third-party complimentary systems
Why do we recommend it?
Auvik is a cloud-based network monitoring system. It reaches into your network, identifies all connected devices, and then creates a map. While SolarWinds Network Performance Monitor also performs those tasks, Auvik is a much lighter tool that you don’t have to host yourself and you don’t need deep technical knowledge to watch over a network with this automated system.
Auvik’s network monitoring system is automated, thanks to its system of thresholds. The service includes out-of-the-box thresholds that are placed on most of the metrics that the network monitor tracks. It is also possible to create custom thresholds.
Once the monitoring service is operating, if any of the thresholds are crossed, the system raises an alert. This mechanism allows technicians to get on with other tasks, knowing that the thresholds give them time to avert system performance problems that would be noticeable to users.
Network management tools that are included in the Auvik package include configuration management to standardize the settings of network devices and prevent unauthorized changes.
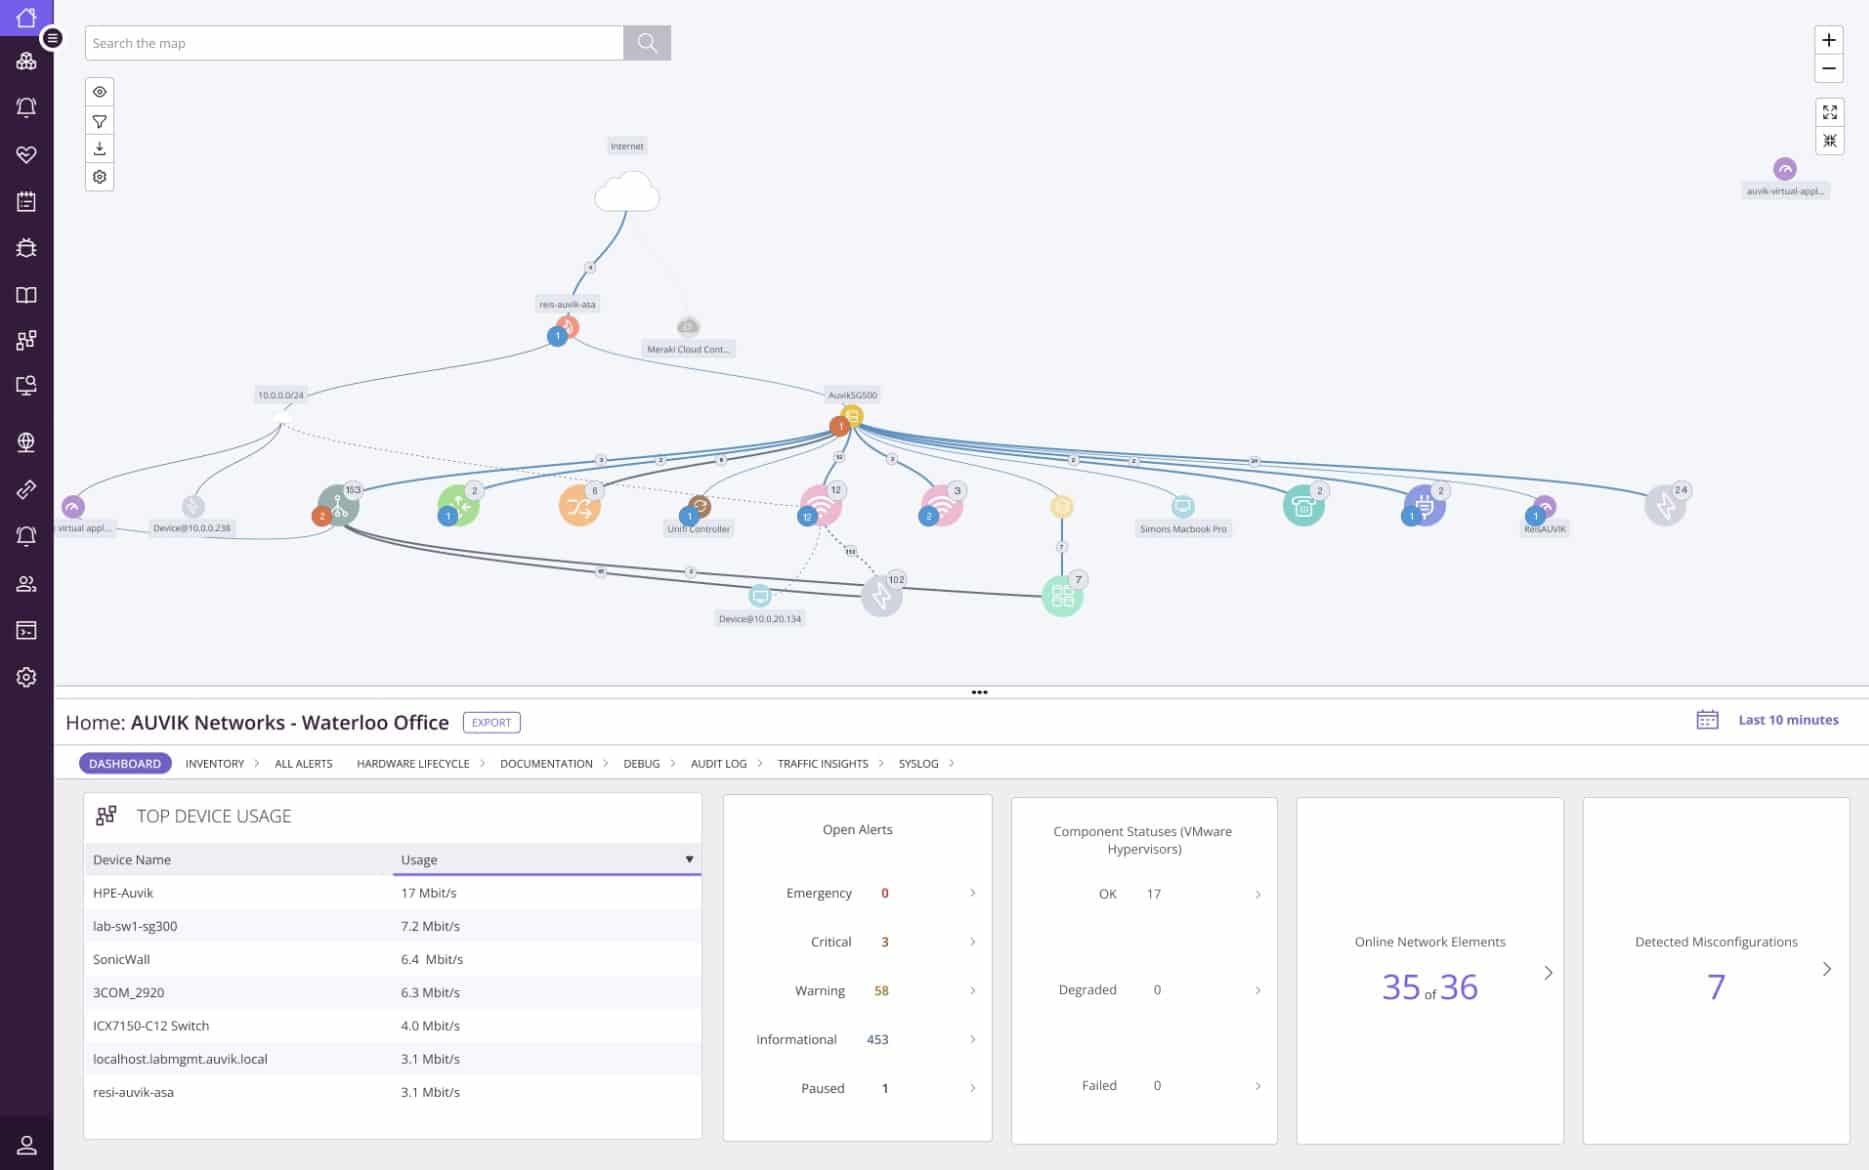
The processing power for Auvik is provided by the service’s cloud servers. However, the system requires collectors to be installed on each monitored site. This software runs on Windows Server and Ubuntu Linux. It is also possible to run the collector on a VM. Wherever the collector is located, the system manager still accesses the service’s console, which is based on the Auvik server, through any standard Web browser.
Who is it recommended for?
Smaller businesses that don’t have a team to support IT would benefit from Auvik. It needs no software maintenance and the system provides automated alerts when issues arise, so your few IT staff can get on with supporting other resources while Auvik looks after the network.
Pros:
- A specialized network monitoring tool
- Additional network management utilities
- Configuration management included
- A cloud-based service that is accessible from anywhere through any standard Web browser
- Data collectors for Windows Server and Ubuntu Linux
Cons:
- The system isn’t expandable with any other Auvik modules
Auvik doesn’t publish its prices by you can access a 14-day free trial.
EDITOR'S CHOICE
Auvik is our top pick for a network monitoring tool because it is a hosted SaaS package that provides all of your network monitoring needs without you needing to maintain the software. The Auvik platform installs an agent on your site and then sets itself up by scanning the network and identifying all devices. The inventory that this system generates gives you details of all of your equipment and provides a basis for network topology maps. Repeated checks on the network gather performance statistics and if any metric crosses a threshold, the tool will generate an alert. You can centralize the monitoring of multiple sites with this service.
Download: Get a 14-day FREE Trial
Official Site: https://www.auvik.com/#trial
OS: Cloud-based
2. Paessler PRTG Network Monitor – FREE TRIAL
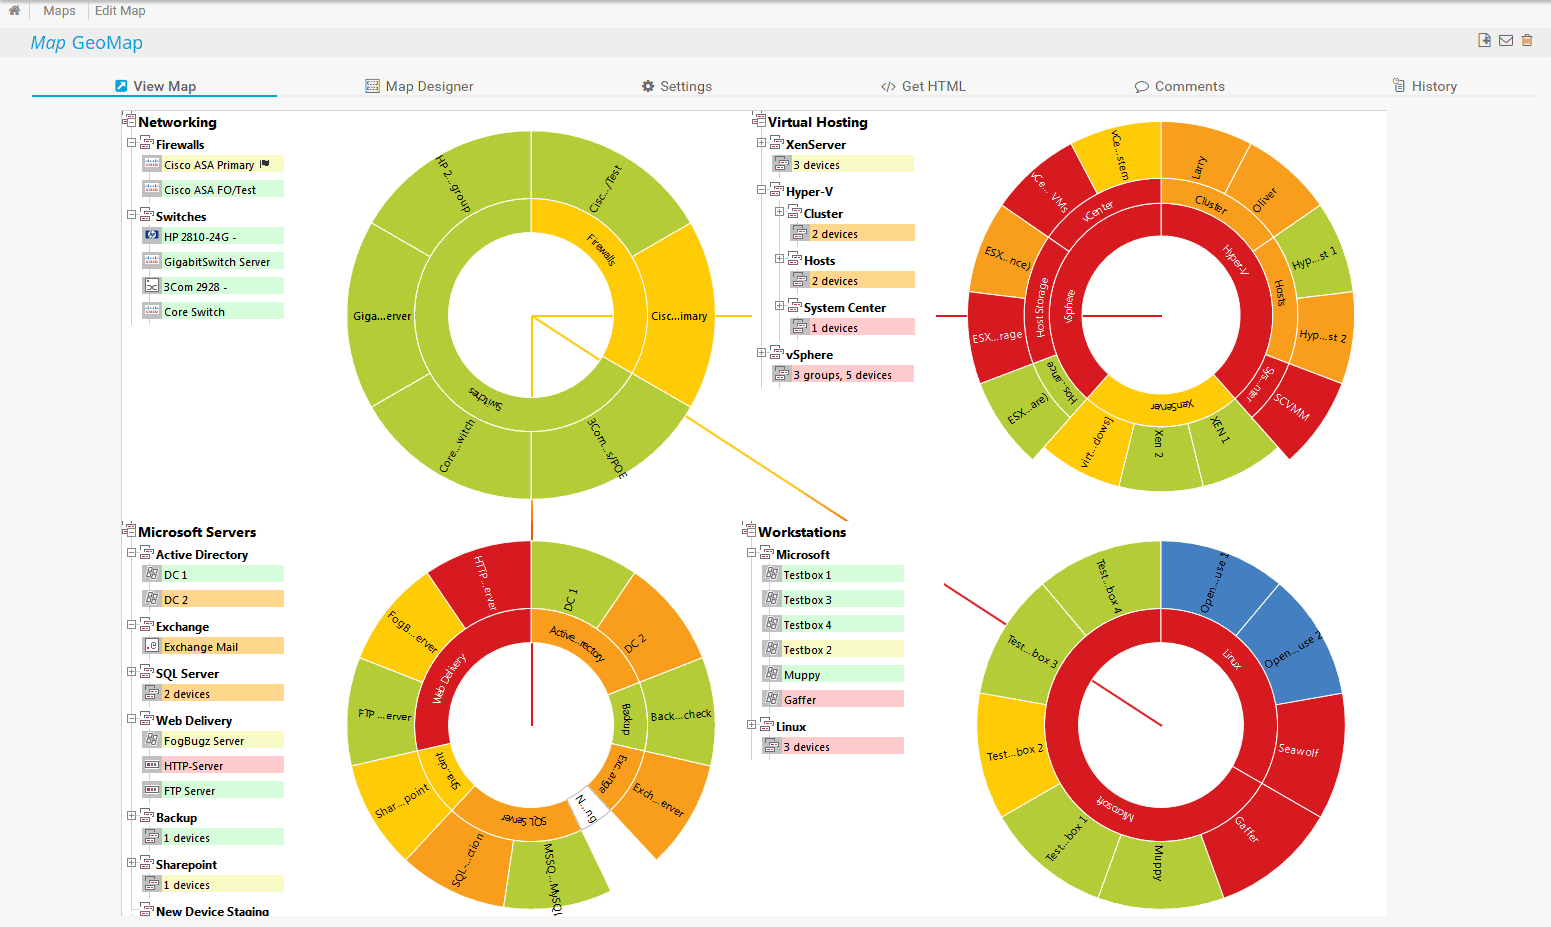
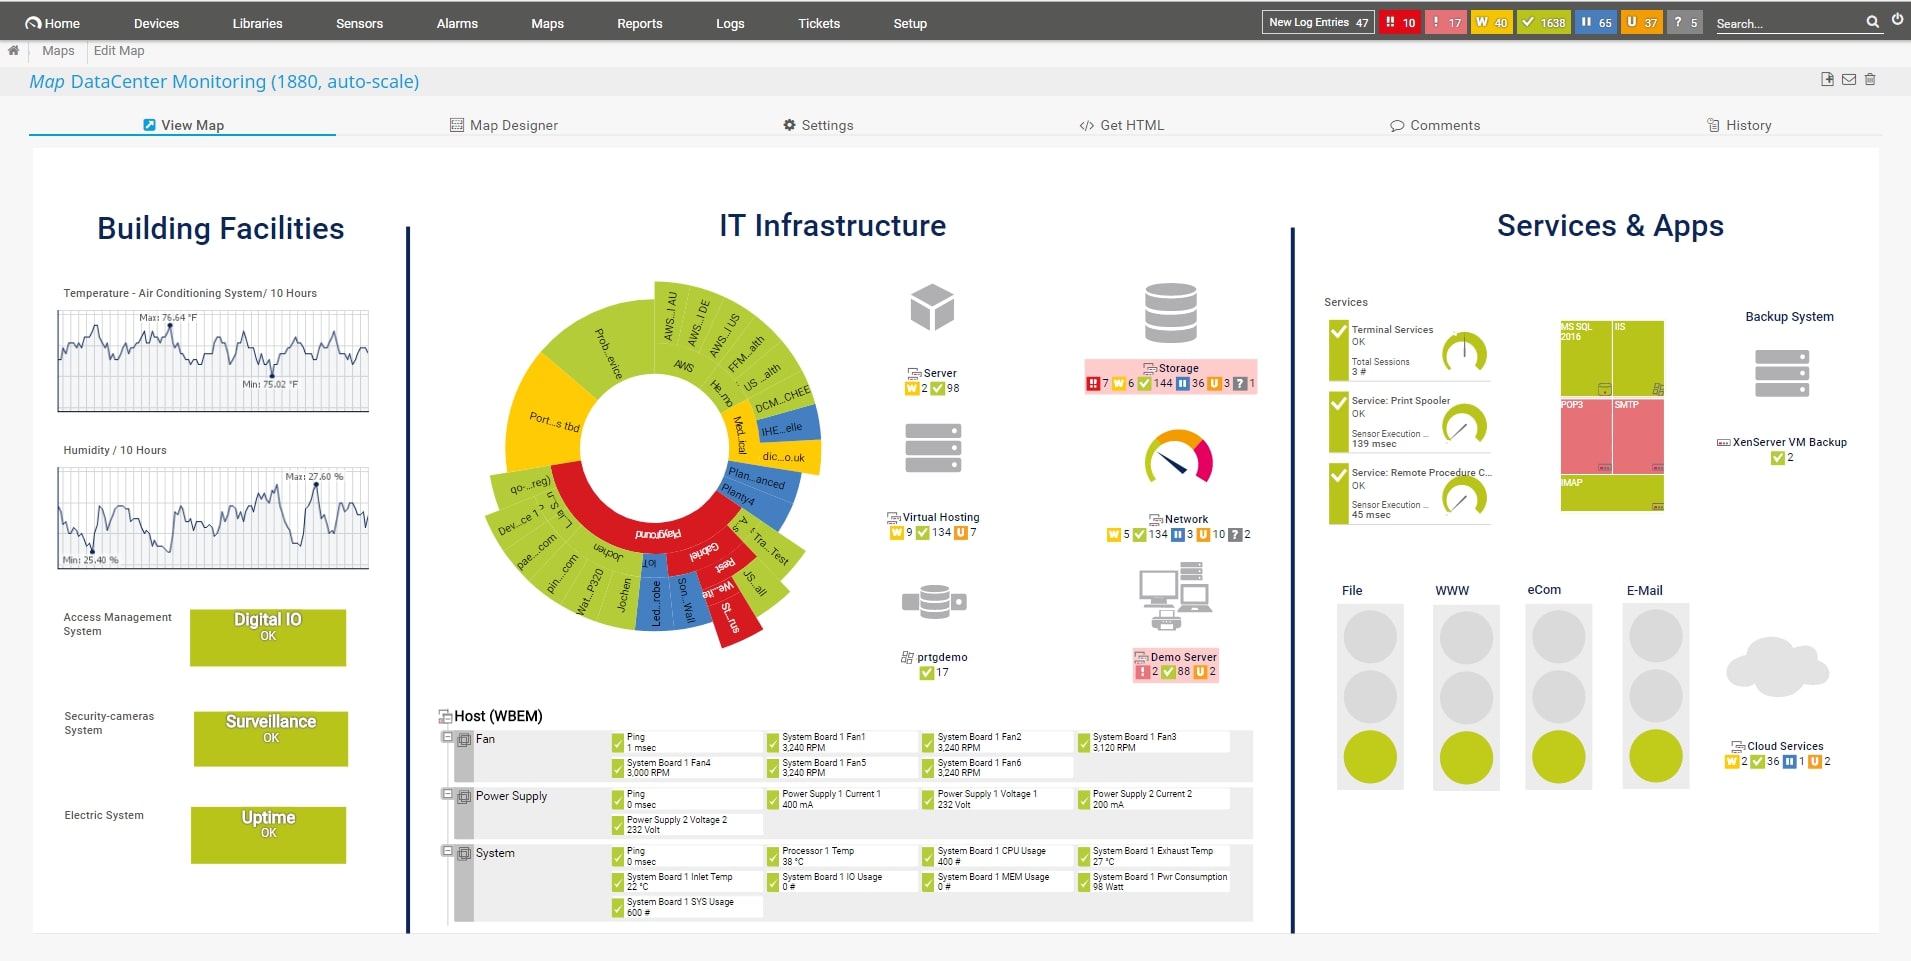
PRTG Network Monitor software is commonly known for its advanced infrastructure management capabilities. All devices, systems, traffic, and applications in your network can be easily displayed in a hierarchical view that summarizes performance and alerts. PRTG monitors the entire IT infrastructure using technology such as SNMP, WMI, SSH, Flows/Packet Sniffing, HTTP requests, REST APIs, Pings, SQL, and a lot more.
Key Features:
- Autodiscovery that creates and maintains a device inventory
- Live network topology maps are available in a range of formats
- Monitoring for wireless networks as well as LANs
- Multi-site monitoring capabilities
- SNMP sensors to gather device health information
- Ping to check on device availability
- Optional extra sensors to monitor servers and applications
- System-wide status overviews and drill-down paths for individual device details
- A protocol analyzer to identify high-traffic applications
- A packet sniffer to collect packet headers for analysis
- Color-coded graphs of live data in the system dashboard
- Capacity planning support
- Alerts on device problems, resource shortages, and performance issues
- Notifications generated from alerts that can be sent out by email or SMS
- Available for installation on Windows Server or as a hosted cloud service
Why do we recommend it?
Paessler PRTG Network Monitor is a very flexible package. Not only does it monitor networks, but it can also monitor endpoints and applications. The PRTG system will discover and map your network, creating a network inventory, which is the basis for automated monitoring. You put together your ideal monitoring system by choosing which sensors to turn on. You pay for an allowance of sensors.
It is one of the best choices for organizations with low experience in network monitoring software. The user interface is really powerful and very easy to use.
A very particular feature of PRTG is its ability to monitor devices in the data center with a mobile app. A QR code that corresponds to the sensor is printed out and attached to the physical hardware. The mobile app is used to scan the code and a summary of the device is displayed on the mobile screen.
In summary, Paessler PRTG is a flexible package of sensors that you can tailor to your own needs by deciding which monitors to activate. The SNMP-based network performance monitoring routines include an autodiscovery system that generates a network asset inventory and topology maps. You can also activate traffic monitoring features that can communicate with switches through NetFlow, sFlow, J-Flow, and IPFIX. QoS and NBAR features enable you to keep your time-sensitive applications working properly.
Who is it recommended for?
PRTG is available in a Free edition, which is limited to 100 sensors. This is probably enough to support a small network. Mid-sized and large organizations should be interested in paying for larger allowances of sensors. The tool can even monitor multiple sites from one location.
Pros:
- Uses a combination of packet sniffing, WMI, and SNMP to report network performance data
- Fully customizable dashboard is great for both lone administrators as well as NOC teams
- Drag and drop editor makes it easy to build custom views and reports
- Supports a wide range of alert mediums such as SMS, email, and third-party integrations into platforms like Slack
- Each sensor is specifically designed to monitor each application, for example, there are prebuilt sensors whose specific purpose is to capture and monitor VoIP activity
- Supports a freeware version
Cons:
- Is a very comprehensive platform with many features and moving parts that require time to learn
PRTG has a very flexible pricing plan, to get an idea visit their official pricing webpage below. It is free to use for up to 50 sensors. Beyond that you get a 30-day free trial to figure out your network requirements.
3. SuperOps – FREE TRIAL
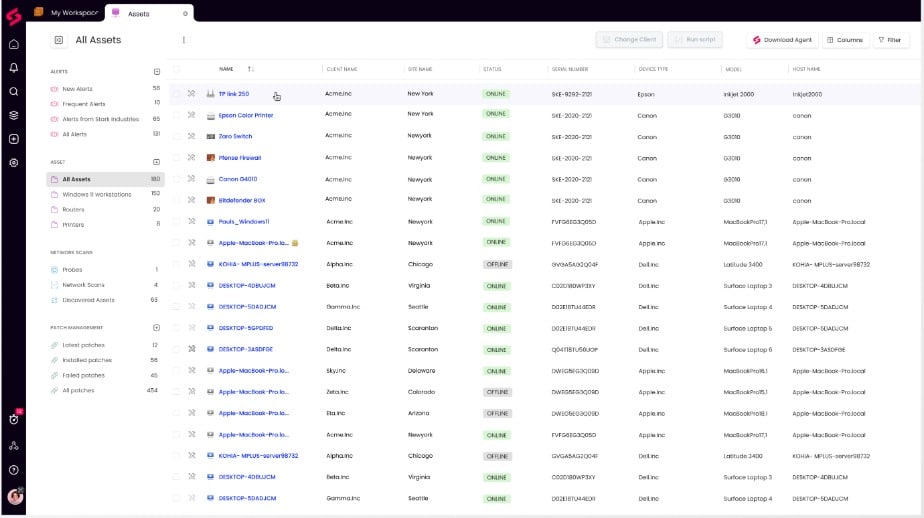
SuperOps Network Monitoring is an automated service that forms part of an RMM bundle. RMM means remote monitoring and management. This package will monitor servers, software, and cloud platforms as well as networks.
Key Features:
- Part of a remote monitoring and management package
- Has a multi-tenant architecture for managed service providers
- A network discovery routine that repeats continuously, spotting new devices on the network
- Creates and maintains a network inventory
- Provides a network topology map that updates automatically with each discovery cycle
- Converts warnings from device agents into alerts
- Alerts for performance problems
- Can provide composite alert conditions
- Improves MSP technician efficiency
Key Features:
- Easy to install, as no agents are required.
- Comes with 680 monitoring targets to start monitoring a wide range of devices out of the box.
- Uses REST APIs to integrate with other applications.
- Executes remote control actions based on configuration and alert thresholds.
- Supports reusable monitoring policies to minimize configurations.
- Enables you to create action scripts that are automatically executed when the prescribed conditions are met.
- Allows you to customize dashboards and graphs to meet your specific needs.
- Supports role-based access.
Why do we recommend it?
This is a comprehensive platform that brings together logs, events, device performance, services, and more to provide accurate insights about your network’s components. Using this data, you can take further actions manually or through automated scripts. More importantly, it helps you make informed decisions, as the data is presented on intuitive dashboards with role-based access controls.
Another highlight of this tool is that it comes built-in with 680+ templates that can be used for monitoring multiple components. It even comes with a drag-and-drop editor for easy customization.
Who is it recommended for?
It is recommended for mid to large organizations that want to monitor a wide range of aspects and components in the network. It also works well for industrial and IoT environments.
Pros:
- Supports hybrid and cloud-first environments.
- Makes it easy to onboard remote service and endpoints.
- Offers timeline views for event correlation.
- Executed automated action scripts.
Cons:
- No dedicated mobile app.
NetCrunch starts at €2,625 for system monitoring, €2,325 for bandwidth and network monitoring, and €16,250 for mixed environments. You can also include option add-ons for more flexibility. Watch a demo. You can also get started on a 30-day free trial.
7. ManageEngine OpManager – FREE TRIAL
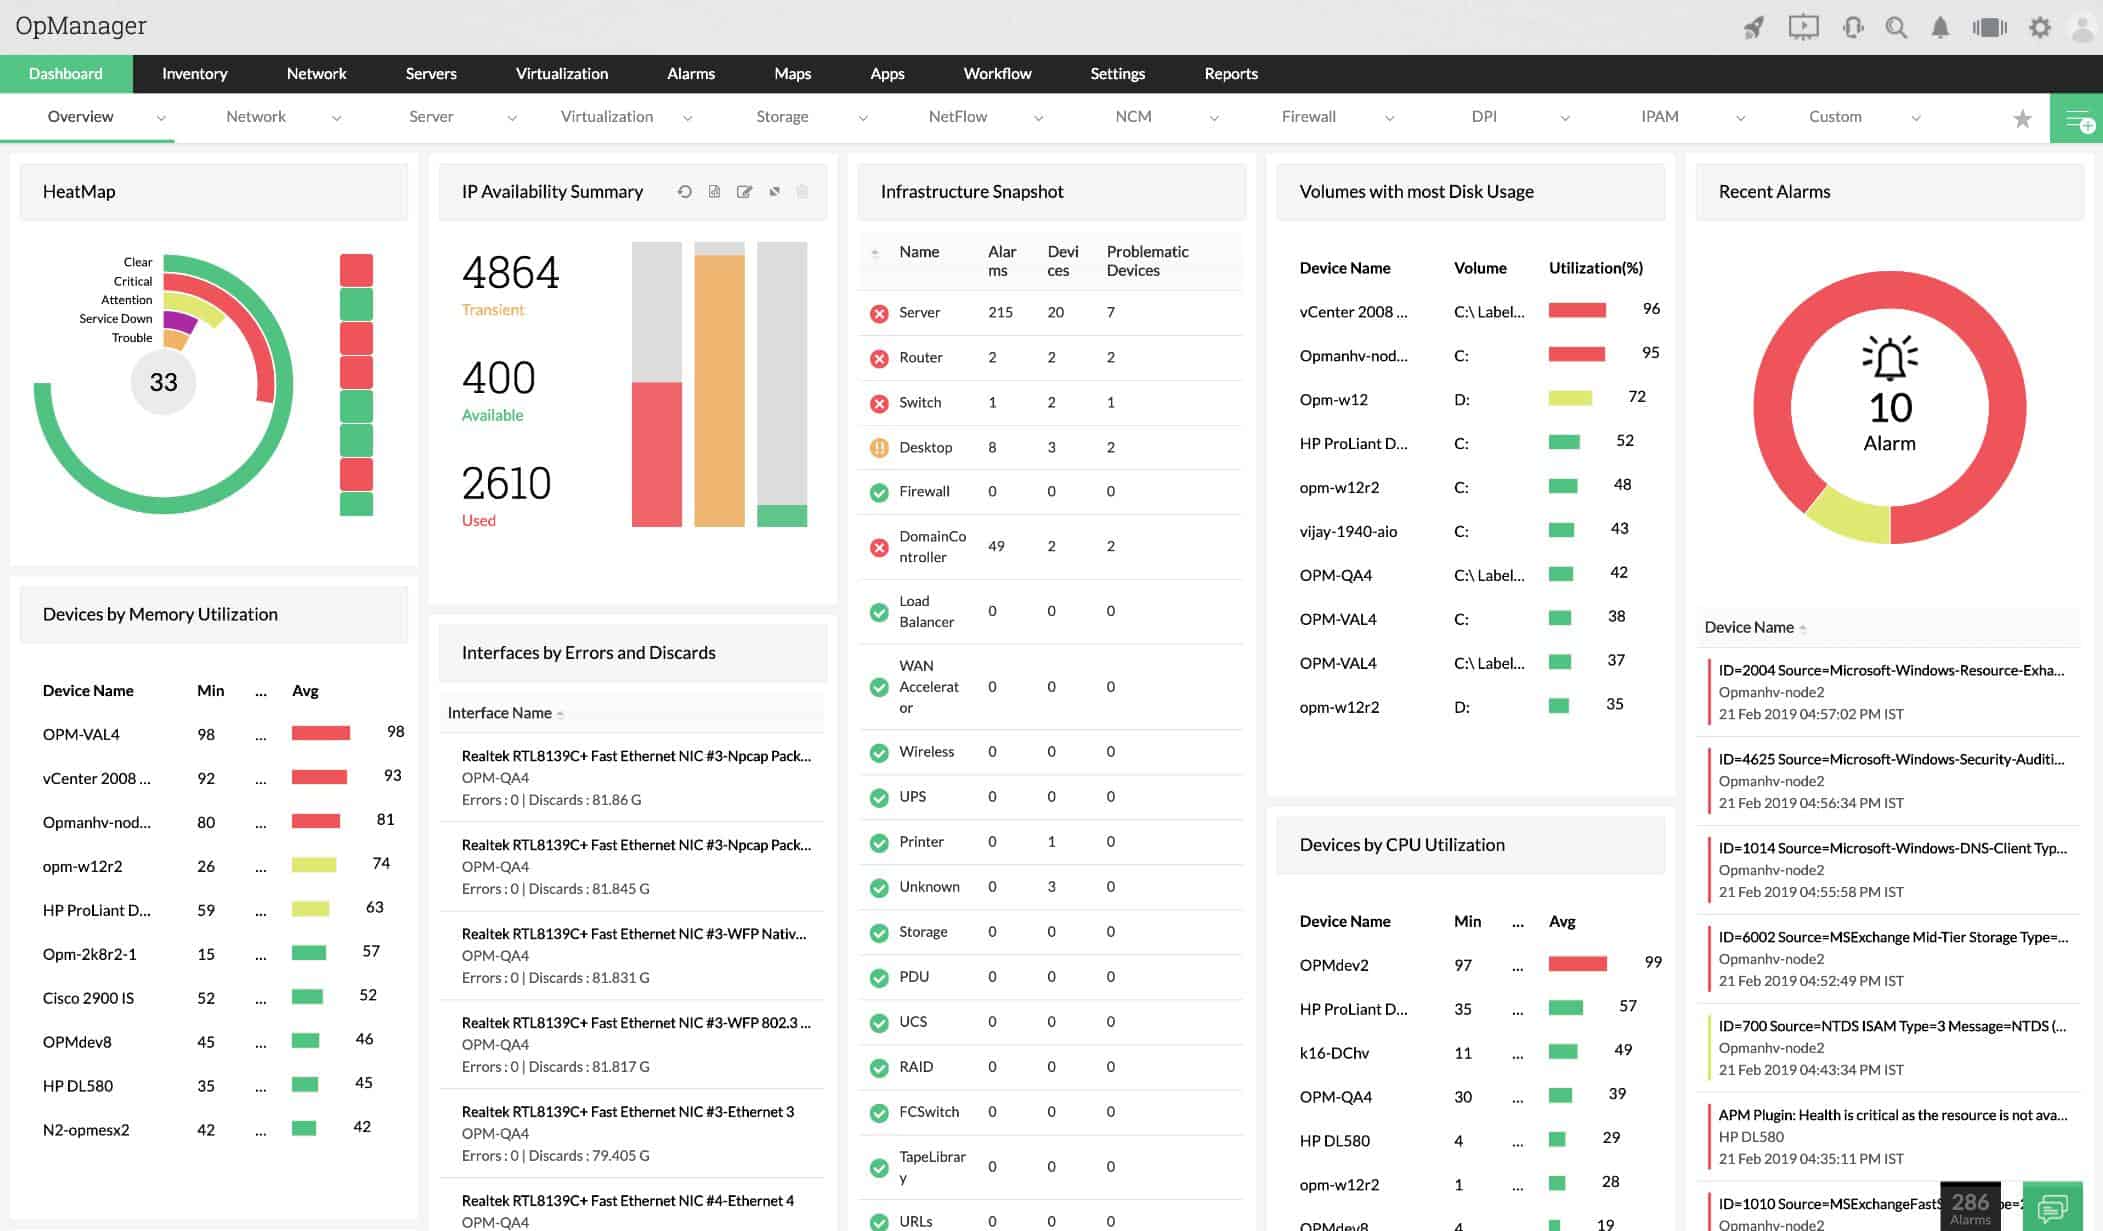
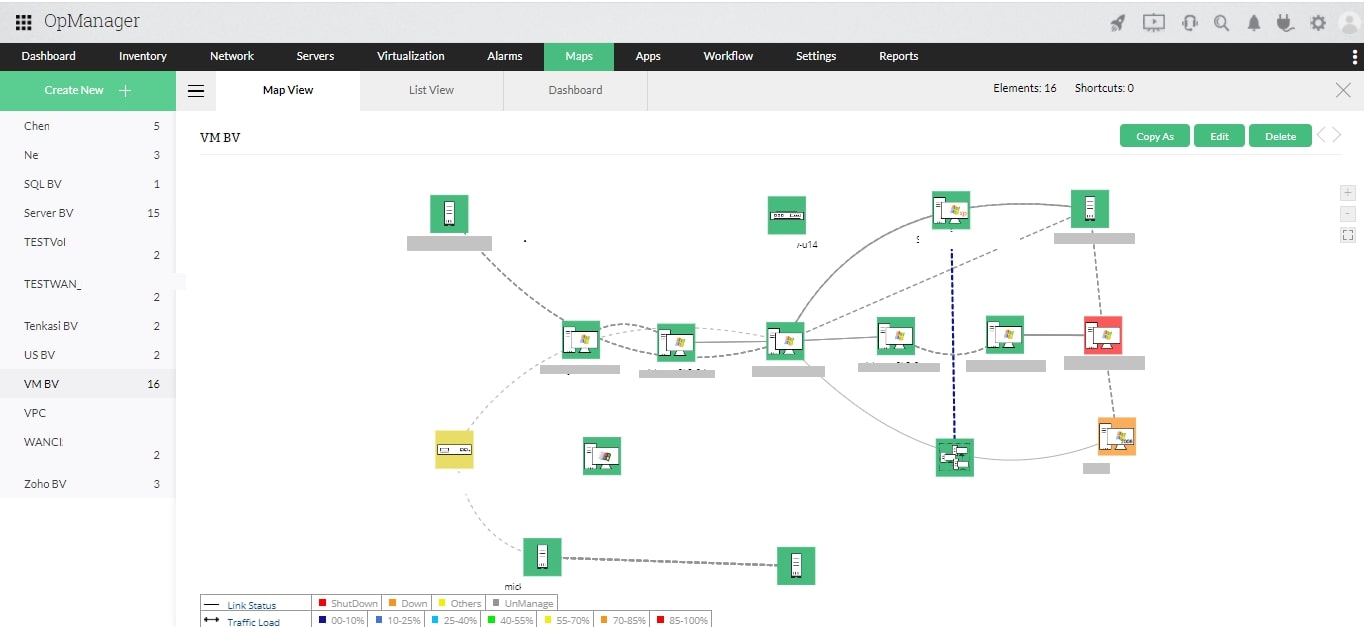
At its core, ManageEngine OpManager is infrastructure management, network monitoring, and application performance management “APM” (with APM plug-in) software.
Key Features:
- Includes server monitoring as well as network monitoring
- Autodiscovery function for automatic network inventory assembly
- Constant checks on device availability
- A range of network topology map options
- Automated network mapping
- Performs an SNMP manager role, constantly polling for device health statuses
- Receives SNMP Traps and generates alerts when device problems arise
- Implements performance thresholds and identifies system problems
- Watches over resource availability
- Customizable dashboard with color-coded dials and graphs of live data
- Forwards alerts to individuals by email or SMS
- Available for Windows Server and Linux
- Can be enhanced by an application performance monitor to create a full stack supervisory system
- Free version available
- Distributed version to supervise multiple sites from one central location
Why do we recommend it?
ManageEngine OpManager is probably the biggest threat to SolarWind’s leading position. This package monitors servers as well as networks. This makes it a great system for monitoring virtualizations.
When it comes to network management tools, this product is well balanced when it comes to monitoring and analysis features.
The solution can manage your network, servers, network configuration, and fault & performance; It can also analyze your network traffic. To run Manage Engine OpManager, it must be installed on-premises.
A highlight of this product is that it comes with pre-configured network monitor device templates. These contain pre-defined monitoring parameters and intervals for specific device types.
The essential edition product can be purchased for $595 which allows up to 25 devices.
Who is it recommended for?
A nice feature of OpManager is that it is available for Linux as well as Windows Server for on-premises installation and it can also be used as a service on AWS or Azure for businesses that don’t want to run their own servers. The pricing for this package is very accessible for mid-sized and large businesses. Small enterprises with simple networks should use the Free edition, which is limited to covering a network with three connected devices.
Pros:
- Designed to work right away, features over 200 customizable widgets to build unique dashboards and reports
- Leverages autodiscovery to find, inventory, and map new devices
- Uses intelligent alerting to reduce false positives and eliminate alert fatigue across larger networks
- Supports email, SMS, and webhook for numerous alerting channels
- Integrates well in the ManageEngine ecosystem with their other products
Cons:
- Is a feature-rich tool that will require a time investment to properly learn
Start 30-day free trial.
8. NinjaOne RMM – FREE TRIAL
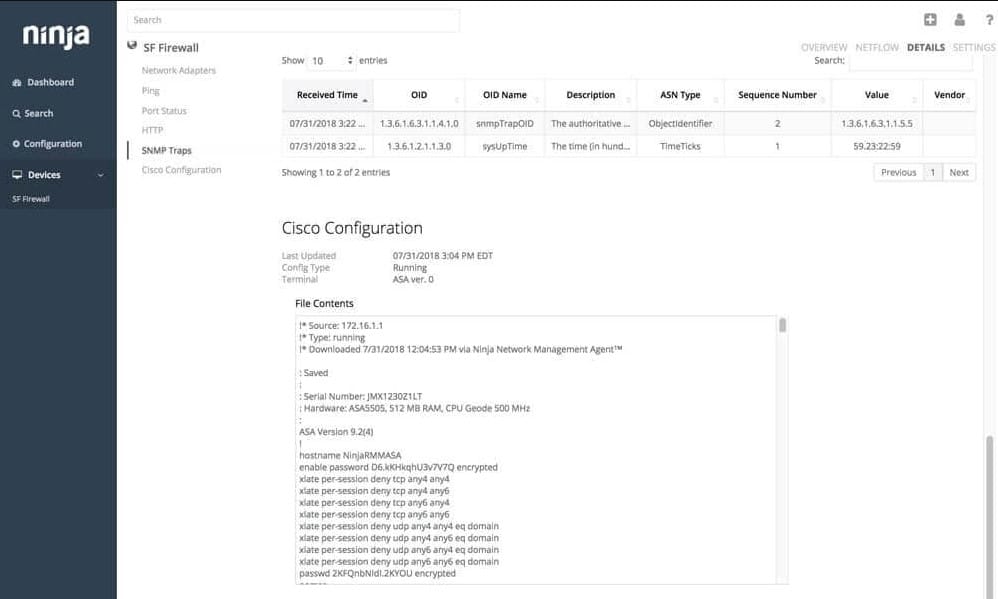
NinjaOne is a remote monitoring and management (RMM) package for managed service providers (MSPs). The system reaches out to each remote network through the installation of an agent on one of its endpoints. The agent acts as an SNMP Manager.
Key Features:
- Based on the Simple Network Management Protocol
- SNMP v1, 2, and 3
- Device discovery and inventory creation
- Continuous status polling for network devices and endpoints
- Live traffic data with NetFlow, IPFIX, J-Flow, and sFlow
- Traffic throughput graphs
- Customizable detail display
- Performance graphs
- Switch port mapper
- Device availability checks
- Syslog processing for device status reports
- Customizable alerts
- Notifications by SMS or email
- Related endpoint monitoring and management
Why do we recommend it?
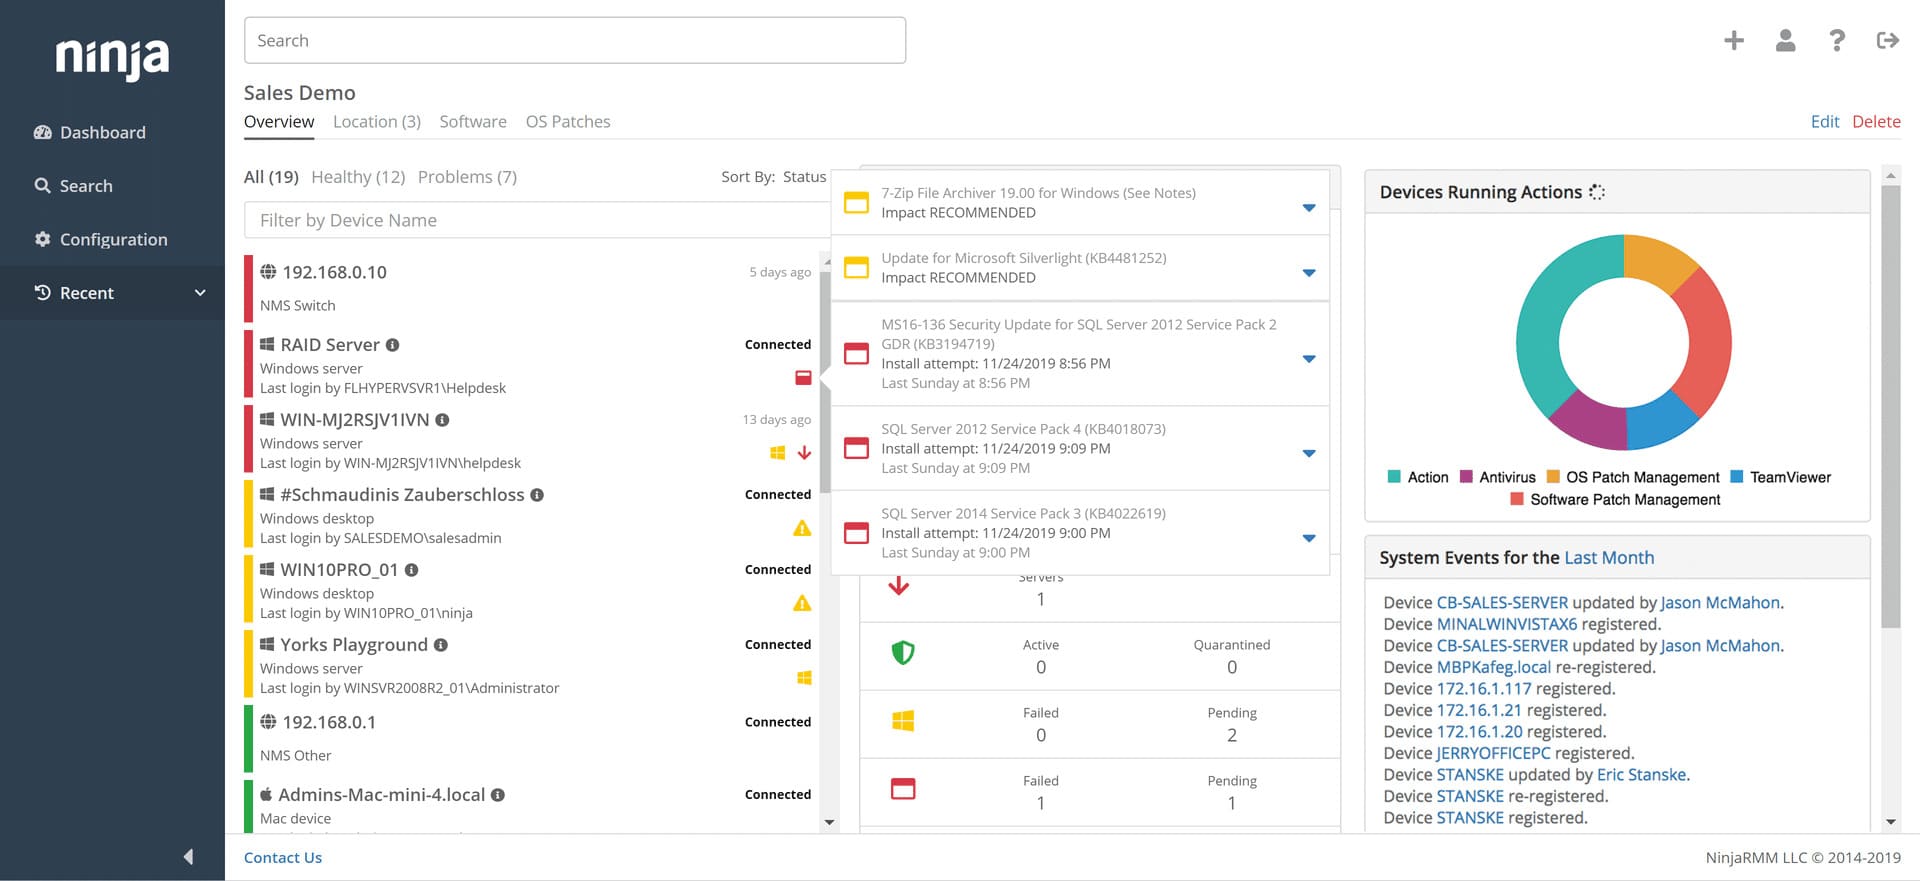
NinjaOne RMM enables each technician to support multiple networks simultaneously. The alerting mechanism in the network monitoring service means that you can assume that everything is working fine on a client’s system unless you receive a notification otherwise. The network tracking service sets itself up automatically with a discovery routine.
The full NinjaOne RMM package provides a full suite of tools for administering a client’s system. The network monitoring service is part of that bundle along with endpoint monitoring and patch management.
The Ninja One system onboards a new client site automatically through a discovery service that creates both hardware and software inventories. The data for each client is kept separate in a subaccount. Technicians that need access to that client’s system for investigation need to be set up with credentials.
The network monitoring system provides both device status tracking and network traffic analysis. The service provides notifications if a dive goes offline or throughput drops.
Who is it recommended for?
This service is built with a multi-tenant architecture for use by managed service providers. However, IT departments can also use the system to manage their own networks and endpoints. The service is particularly suitable for simultaneously monitoring multiple sites. The console for the RMM is based in the cloud and accessed through any standard Web browser.
Pros:
- A cloud-based package that onboards sites through the installation of an agent
- Auto discovery for network devices and endpoints
- Network device status monitoring
- Network traffic analysis
- Syslog message scanning
Cons:
- No price list
NinjaOne doesn’t publish a price list so you start your buyer’s journey by accessing a 14-day free trial.
9. Site24x7 Network Monitoring – FREE TRIAL
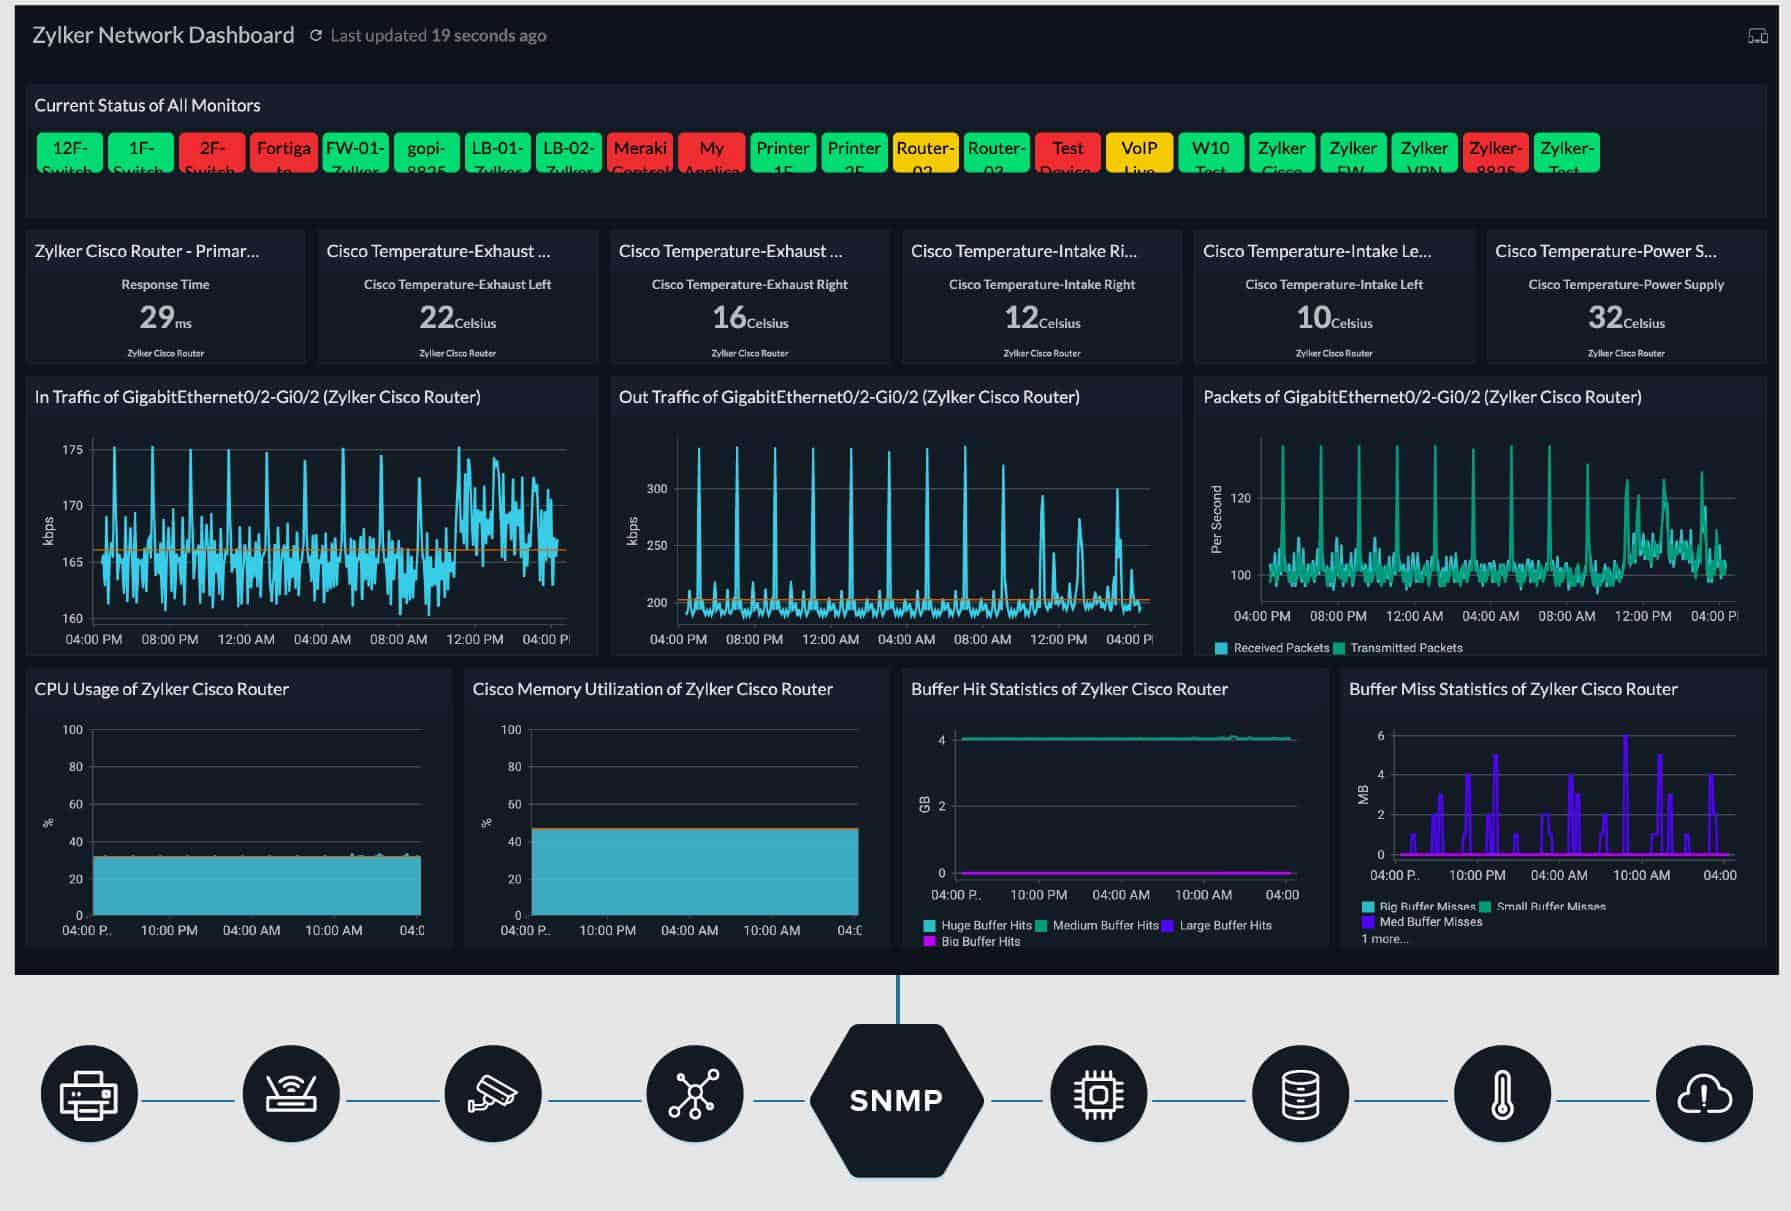
Site24x7 is a monitoring service that covers networks, servers, and applications. The network monitoring service in this package starts off by exploring the network for connected devices. IT logs its findings in a network inventory and draws up a network topology map.
Key Features:
- A hosted cloud-based service that includes CPU time and performance data storage space
- Can unify the monitoring of networks on site all over the world
- Uses SNMP to check on device health statuses
- Gives alerts on resource shortages, performance issues, and device problems
- Generates notifications to forward alerts by email or SMS
- Root cause analysis features
- Autodiscovery for a constantly updated network device inventory
- Automatic network topology mapping
- Includes internet performance monitoring for utilities such as VPNs
- Specialized monitoring routines for storage clusters
- Monitors boundary and edge services, such as load balancers
- Offers overview and detail screens showing the performance of the entire network and also individual devices
- Includes network traffic flow monitoring
- Facilities for capacity planning and bottleneck identification
- Integrates with application monitoring services to create a full stack service
Why do we recommend it?
Site24x7 Network Monitoring is part of a platform that is very similar to Datadog. A difference lies in the number of modules that Site24x7 offers – it has far fewer than Datadog. Site24x7 bundles its modules into packages with almost all plans providing monitoring for networks, servers, services, applications, and websites. Site24x7 was originally developed to be a SaaS plan for ManageEngine but then was split out into a separate brand, so there is very solid expertise behind this platform.
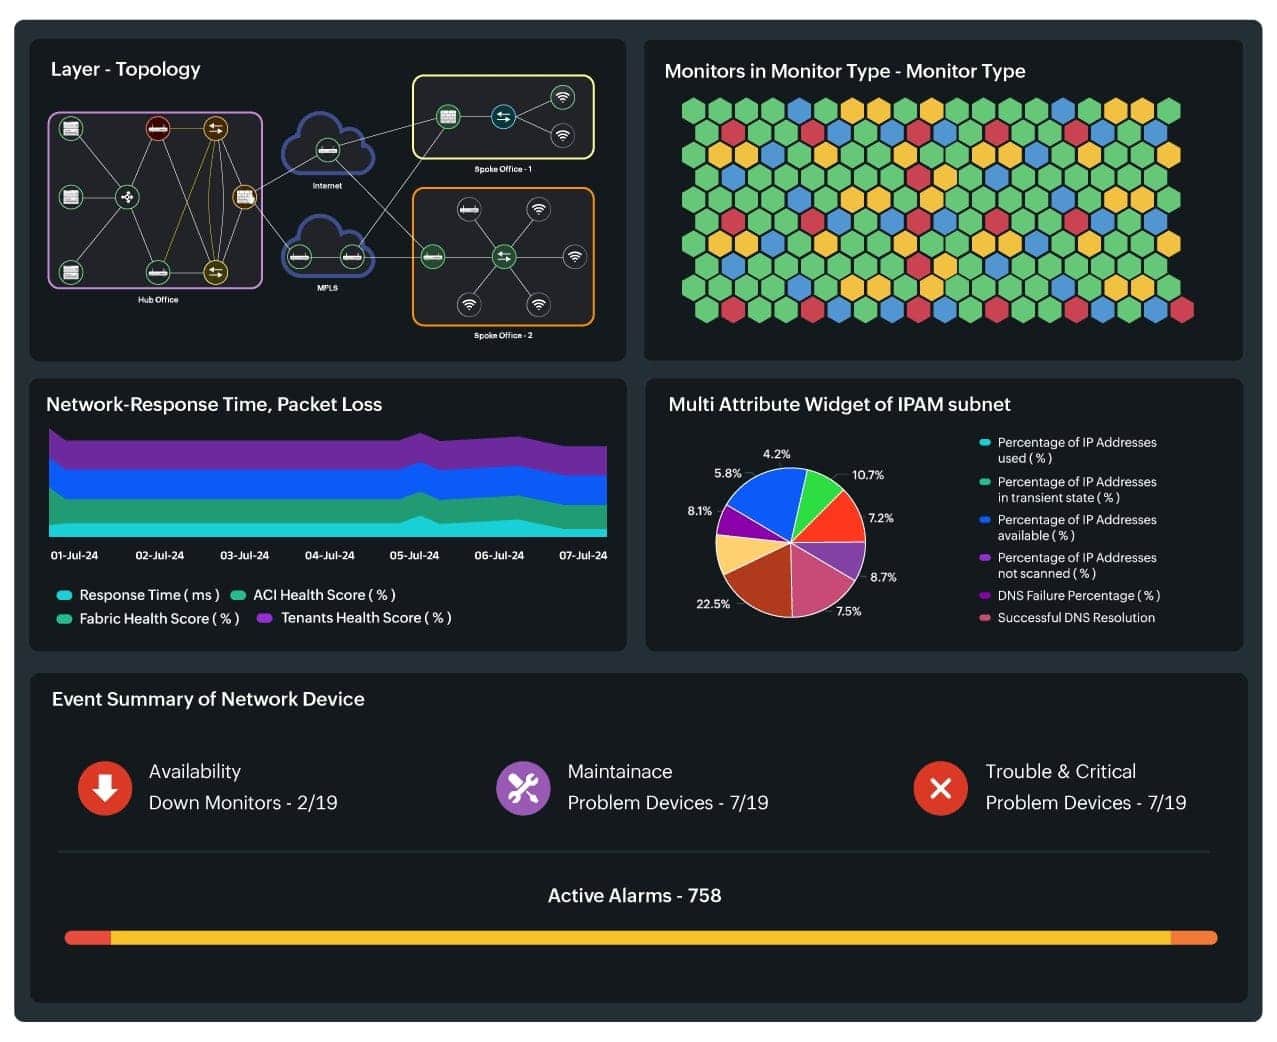
The Network Monitor uses procedures from the Simple Network Management Protocol (SNMP) to poll devices every minute for status reports. Any changes in the network infrastructure that are revealed by these responses update the inventory and topology map.
The results of the device responses are interpreted into live data in the dashboard of the monitor. The dashboard is accessed through any standard browser and its screens can be customized by the user.
The SNMP system empowers device agents to send out a warning without waiting for a request if it detects a problem with the device that it is monitoring. Site24x7 Infrastructure catches these messages, which are called Traps, and generates an alert. This alert can be forwarded to technicians by SMS, email, voice call, or instant messaging post.
The Network Monitor also has a traffic analysis function. This extracts throughput figures from switches and routers and displays data flow information in the system dashboard. This data can also be used for capacity planning.
Who is it recommended for?
The plans for Site24x7 are very reasonably priced, which makes them accessible to businesses of all sizes. Setup for the system is automated and much of the ongoing monitoring processes are carried out without any manual intervention.
Pros:
- One of the most holistic monitoring tools available, supporting networks, infrastructure, and real user monitoring in a single platform
- Uses real-time data to discover devices and build charts, network maps, and inventory reports
- Is one of the most user-friendly network monitoring tools available
- User monitoring can help bridge the gap between technical issues, user behavior, and business metrics
- Supports a freeware version for testing
Cons:
- Is a very detailed platform that will require time to fully learn all of its features and options
Site24x7 costs $9 per month when paid annually. It is available for a free trial.
10. ManageEngine RMM Central – FREE TRIAL
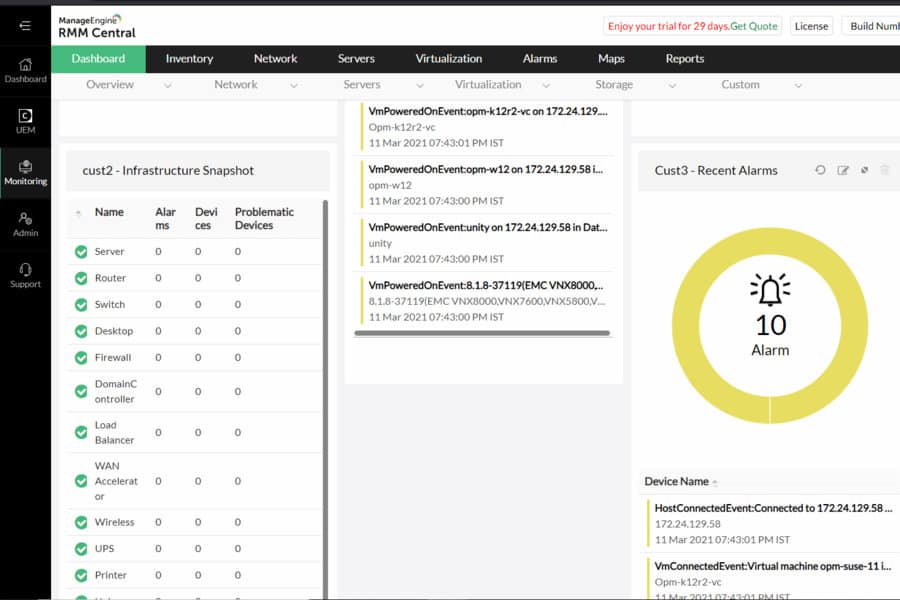
ManageEngine RMM Central provides sysadmins with everything they need to support their network. Automated asset discovery makes deployment simple, allowing you to collect all devices on your network by the end of the day.
Key Features
- Automated network monitoring and asset discovery
- Built-in remote access with various troubleshooting tools
- Flexible alert integrations
With network and asset metrics collected, administrators can quickly see critical insights automatically generated by the platform. With over 100 automated reports it’s easy to see exactly where your bottlenecks are and what endpoints are having trouble.
Administrators can configure their own SLAs with various automated alert options and even pair those alerts with other automation that integrate into their helpdesk workflow.
Pros:
- Uses a combination of packet sniffing, WMI, and SNMP to report network performance data
- Fully customizable dashboard is great for both lone administrators as well as NOC teams
- Drag and drop editor makes it easy to build custom views and reports
- Supports a wide range of alert mediums such as SMS, email, and third-party integrations into platforms like Slack
Cons:
- Is a very comprehensive platform with many features and moving parts that require time to learn
Start a 30-day free trial.
11. Atera
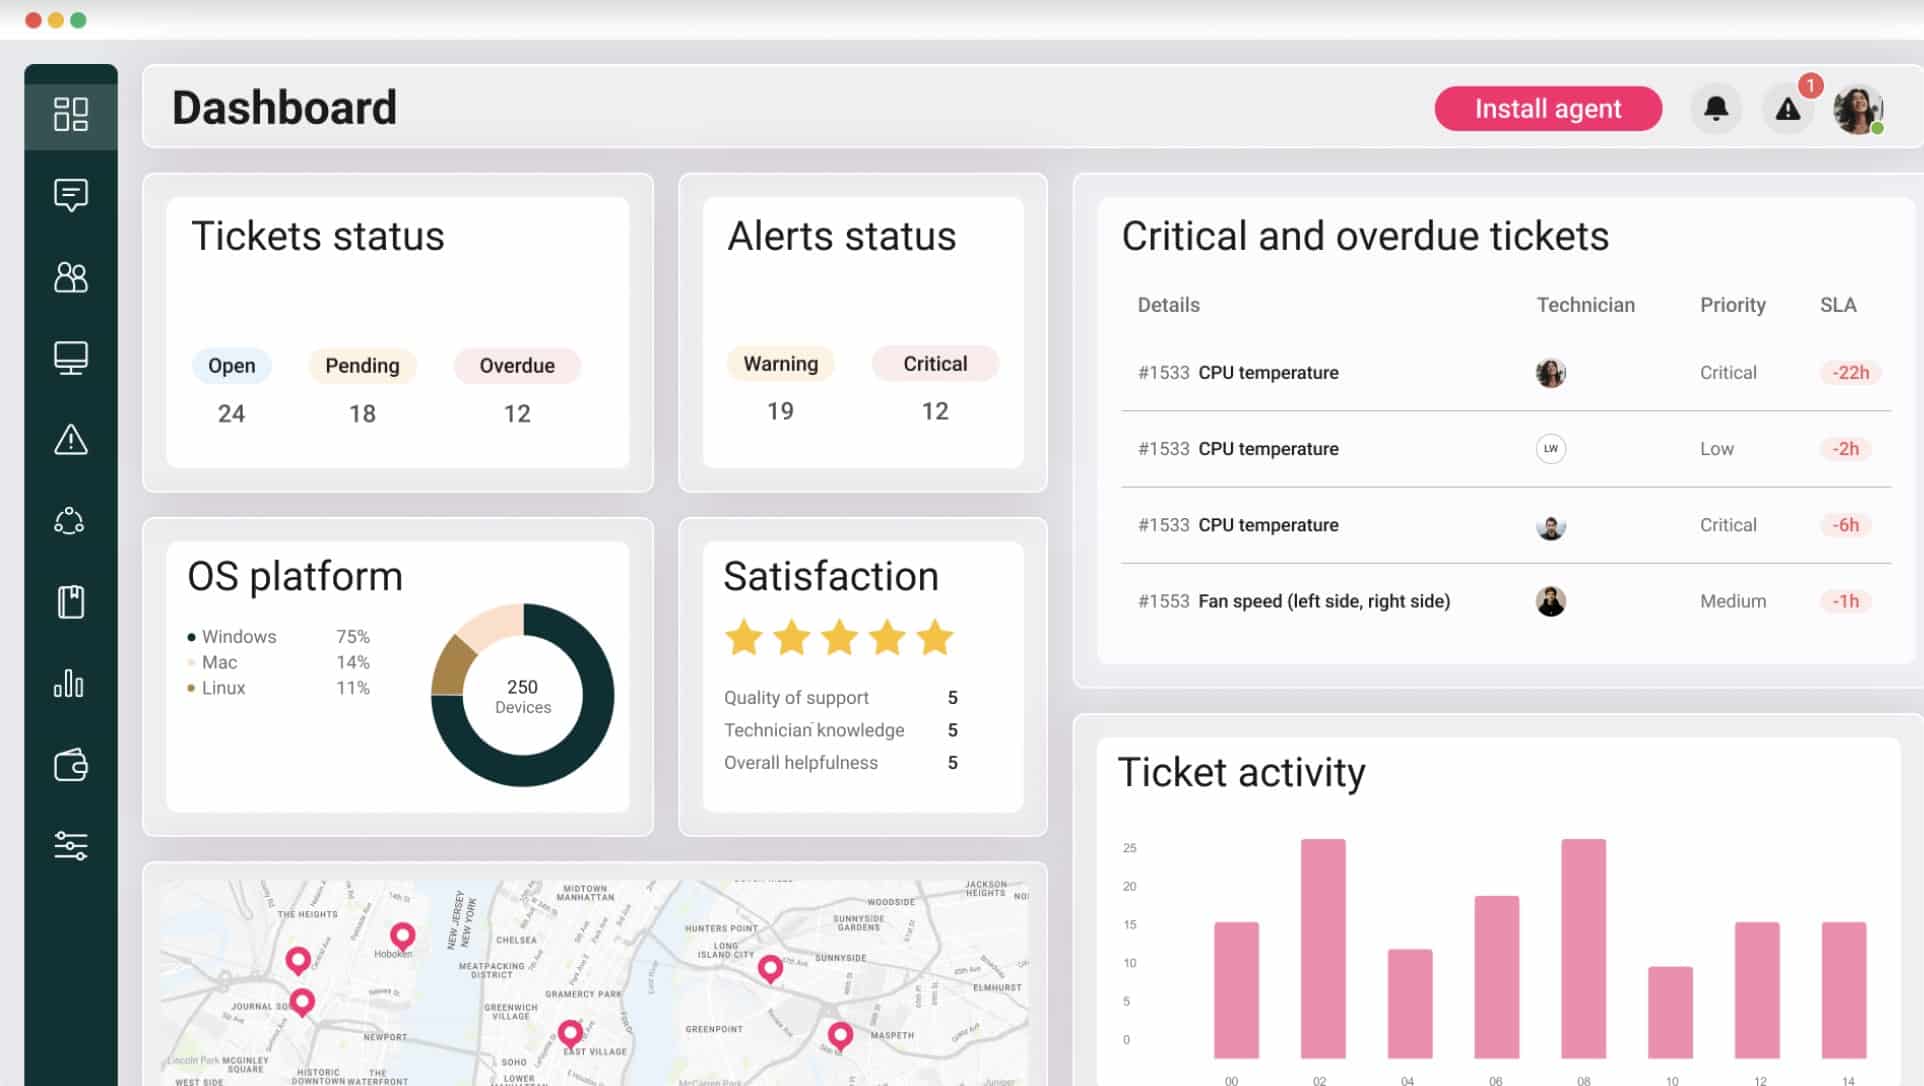
Atera is a package software that was built for managed service providers. It is a SaaS platform and it includes professional service automation (PSA) and remote monitoring and management (RMM) systems.
Why do we recommend it?
Atera is a package of tools for managed service providers (MSPs). Alongside remote network monitoring capabilities, this package provides automated monitoring services for all IT operations. The package also includes some system management tools, such as a patch manager. Finally, the Atera platform offers Professional Services Automation (PSA) tools to help the managers of MSPs to run their businesses.
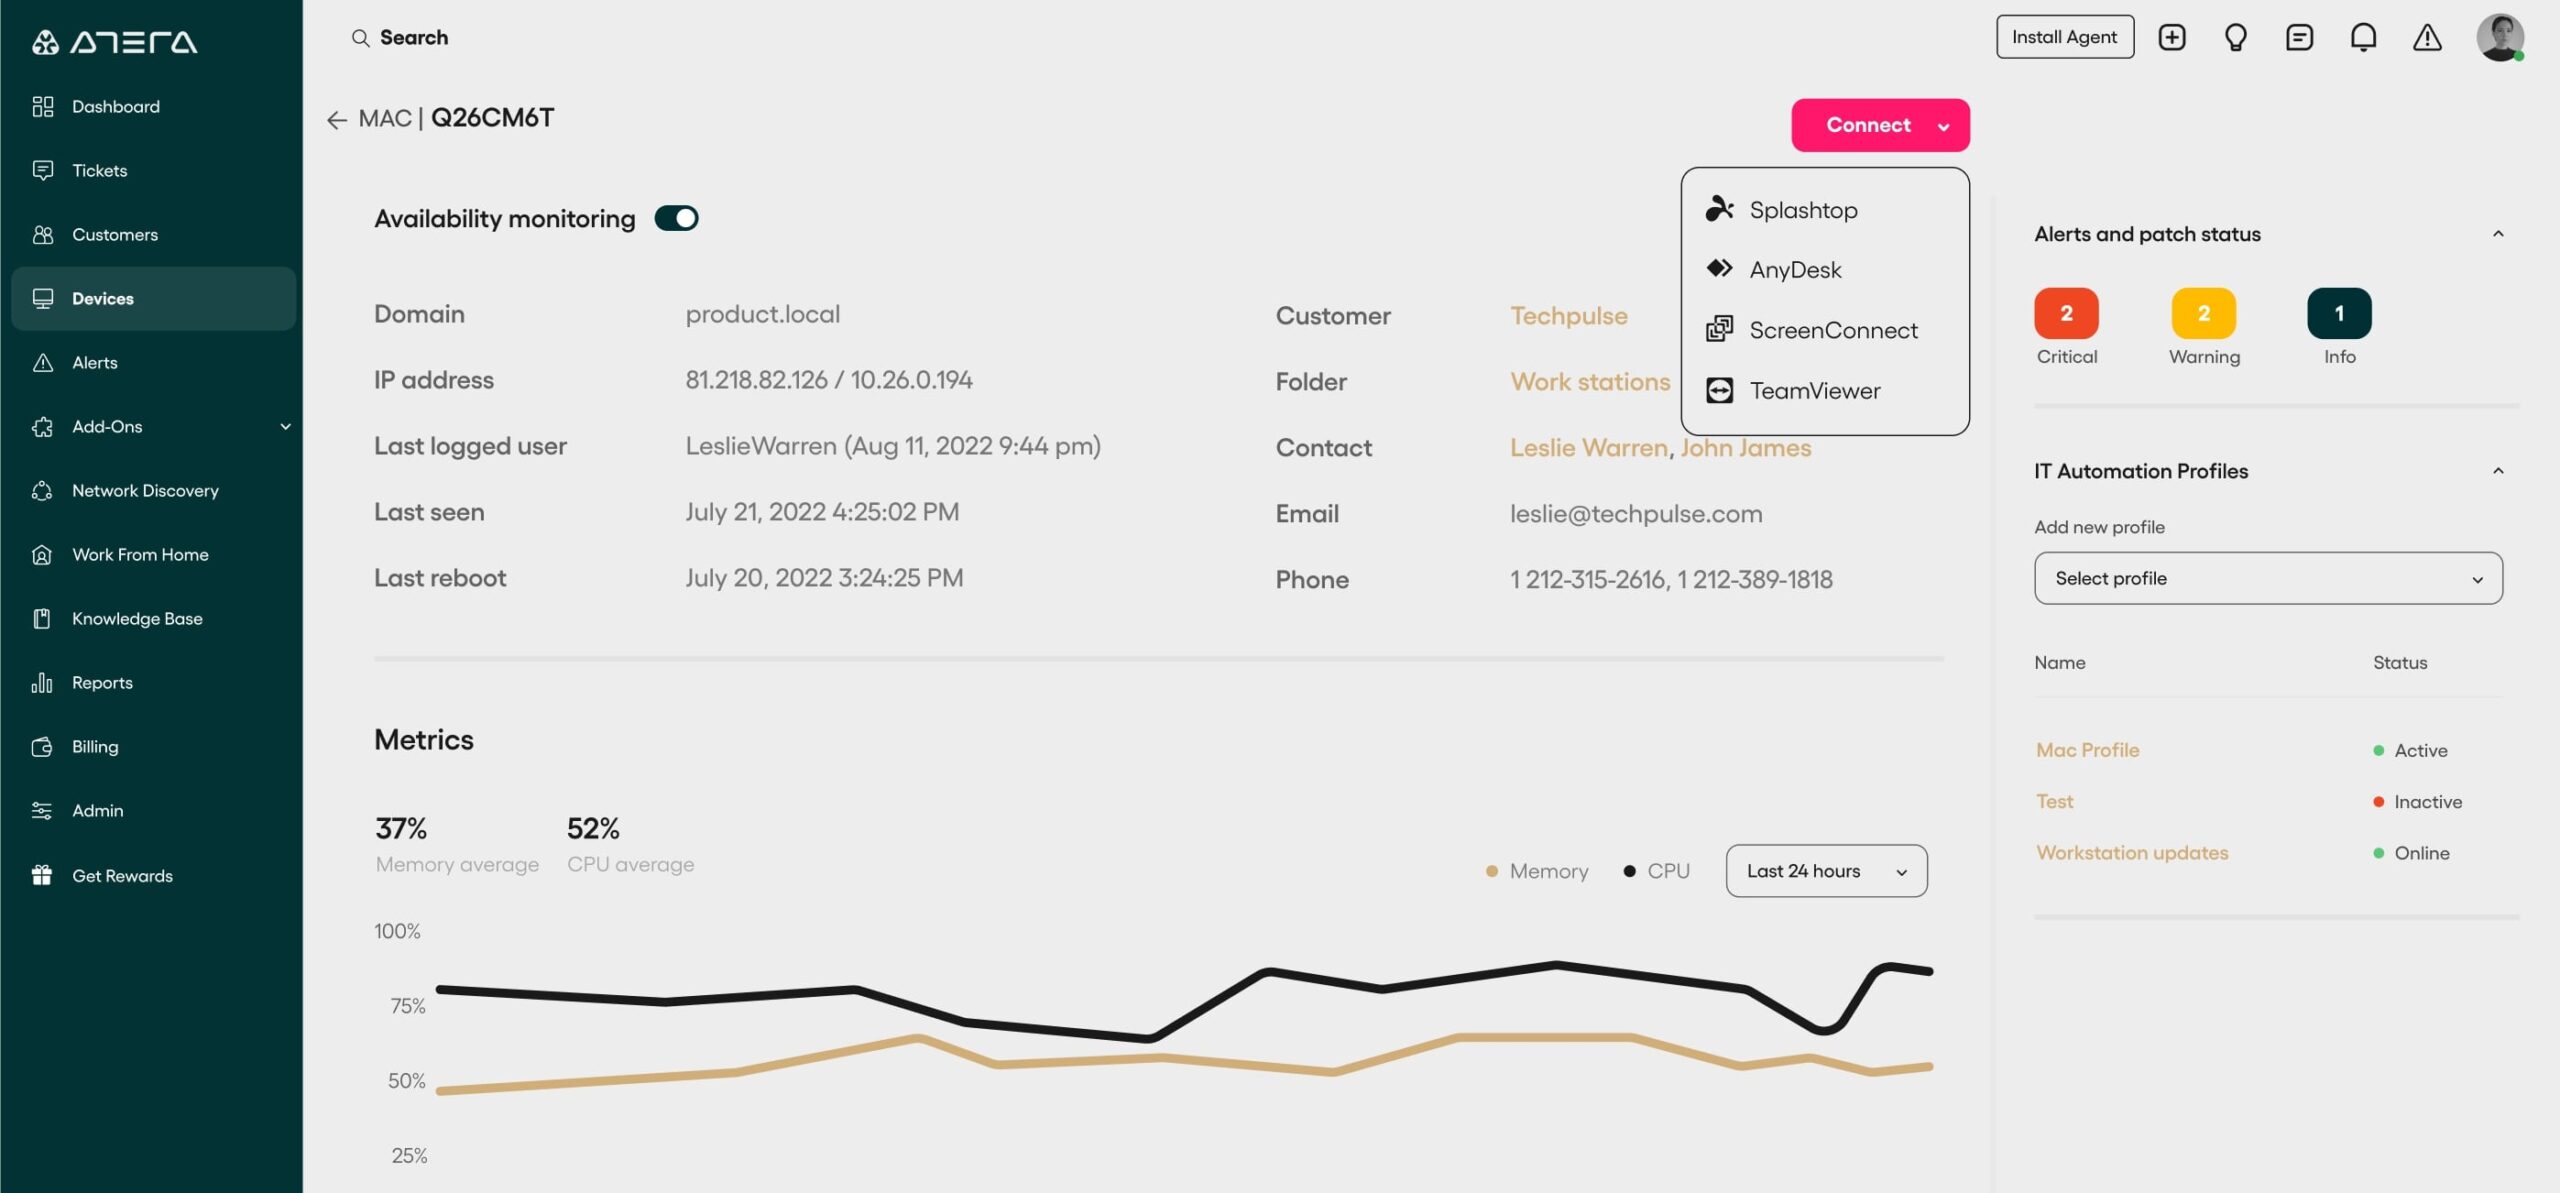
The network monitoring system operates remotely through an agent that installs on Windows Server. The agent enables the service to scour the network and identify all of the network devices that run it. This is performed using SNMP, with the agent acting as the SNMP Manager.
The SNMP system enables the agent to spot Traps, which warn of device problems. These are sent to the Atera network monitoring dashboard, where they appear as alerts. Atera offers an automated topology mapping service, but this is an add-on to the main subscription packages.
Who is it recommended for?
Atera charges for its platform per technician, so it is very affordable for MSPs of all sizes. This extends to sole technicians operating on a contract basis and possibly fielding many small business clients.
Pros:
- Remote automated network discovery
- Network performance monitoring with SNMP
- Alerts for notified device problems
- Also includes remote system management tools
- Scalable pricing with three plan levels
- 30-day free trial
Cons:
- Network mapping costs extra
You can start a 30-day free trial.
12. Obkio
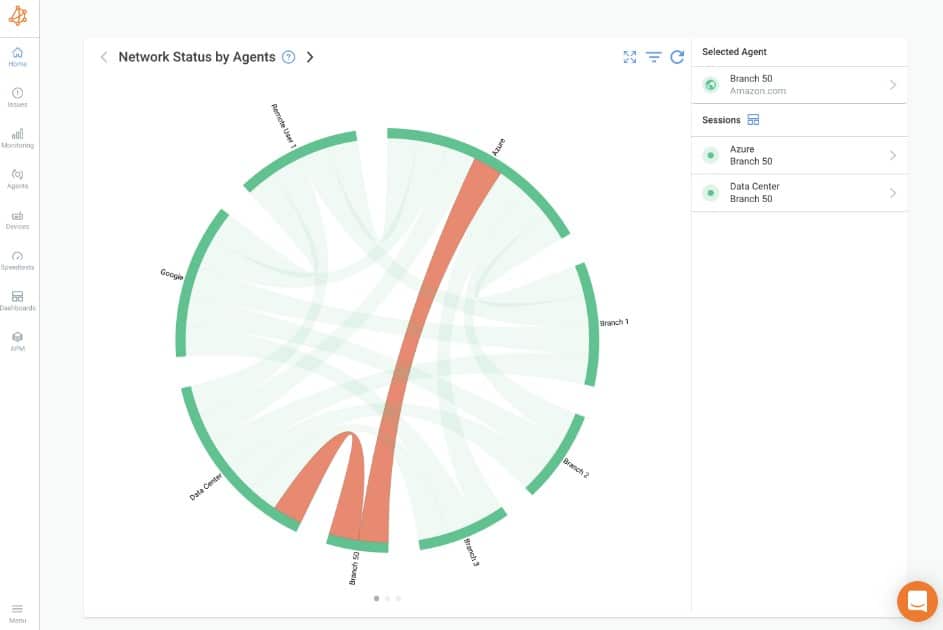
Obkio is a simple and proactive tool for monitoring all the devices and applications in your network. It continuously monitors the devices, processes, applications, and other components in your network to ensure that they are all working as expected.
Key Features:
- Captures real-time data for immediate visibility.
- Monitors all environments, including WAN, LAN, VPN, Cloud, and more.
- Measures the Quality of Experience (QoE) for VoIP.
- Provides visual tools for root cause analysis.
- Performs historical data and trend analysis.
- Sends relevant alerts for immediate troubleshooting.
Why do we recommend it?
Obkio uses agent-based architecture to gather data from different devices and analyzes them for anomalies. Based on the findings, it sends alerts and notifications to administrators along with the root cause analysis for troubleshooting. A fairly simple tool that focuses on improving the performance of your network and reducing the chances of downtime due to its proactive monitoring.
Who is it recommended for?
It is recommended for network administrators working across organizations of all sizes. It is also highly useful for MSPs who monitor client networks.
Pros:
- Support for a wide range of devices.
- Provides insights into the root cause of the problem.
- Easy to set up and use.
- Caters to use cases across environments.
Cons:
- Limited reporting in the base plan.
Obkio’s base Starter Plan is priced at $224 per month when paid annually. Start a 14-day free trial.
13. Datadog Network Monitoring
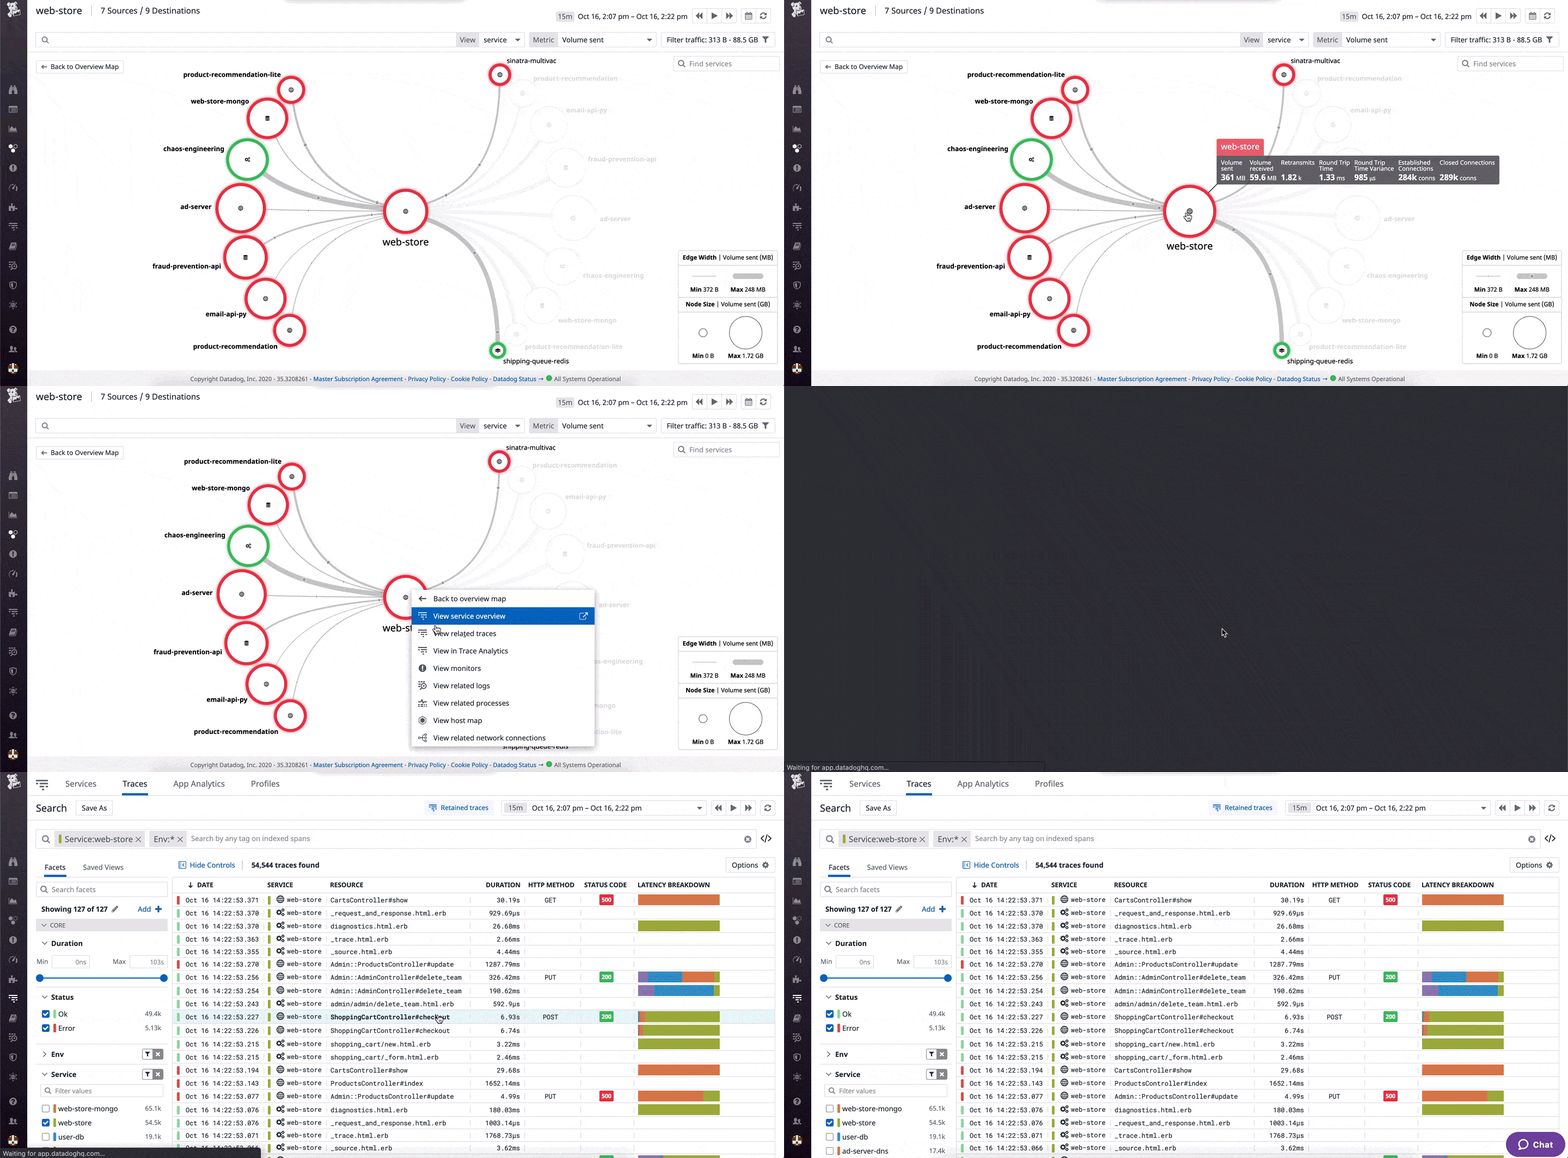
Datadog Network Monitoring supervises the performance of network devices. The service is a cloud-based system that is able to explore a network and detect all connected devices. With the information from this research, the network monitor will create an asset inventory and draw up a network topology map. This procedure means that the system performs its own setup routines.
Features of this package include:
- Monitors networks anywhere, including remote sites
- Joins together on-premises and cloud-based resource monitoring
- Integrates with other Datadog modules, such as log management
- Offers an overview of all network performance and drill-down details of each device
- Facilitates troubleshooting by identifying performance dependencies
- Includes DNS server monitoring
- Gathers SNMP device reports
- Blends performance data from many information sources
- Includes data flow monitoring
- Offers tag-based packet analysis utilities in the dashboard
- Integrates protocol analyzers
- Performance threshold baselining based on machine learning
- Alerts for warnings over evolving performance issues
- Packages offer network performance monitoring tools (traffic analysis) or network device monitoring
- Subscription charges with no startup costs
Why do we recommend it?
Datadog Network Monitoring services are split into two modules that are part of a cloud platform of many system monitoring and management tools. These two packages are called Network Performance Monitoring and Network Device Monitoring, which are both subscription services. While the device monitoring package works through SNMP, the performance monitor measures network traffic levels.
The autodiscovery process is ongoing, so it spots any changes you make to your network and instantly updates the inventory and the topology map. The service can also identify virtual systems and extend monitoring of links out to cloud resources.
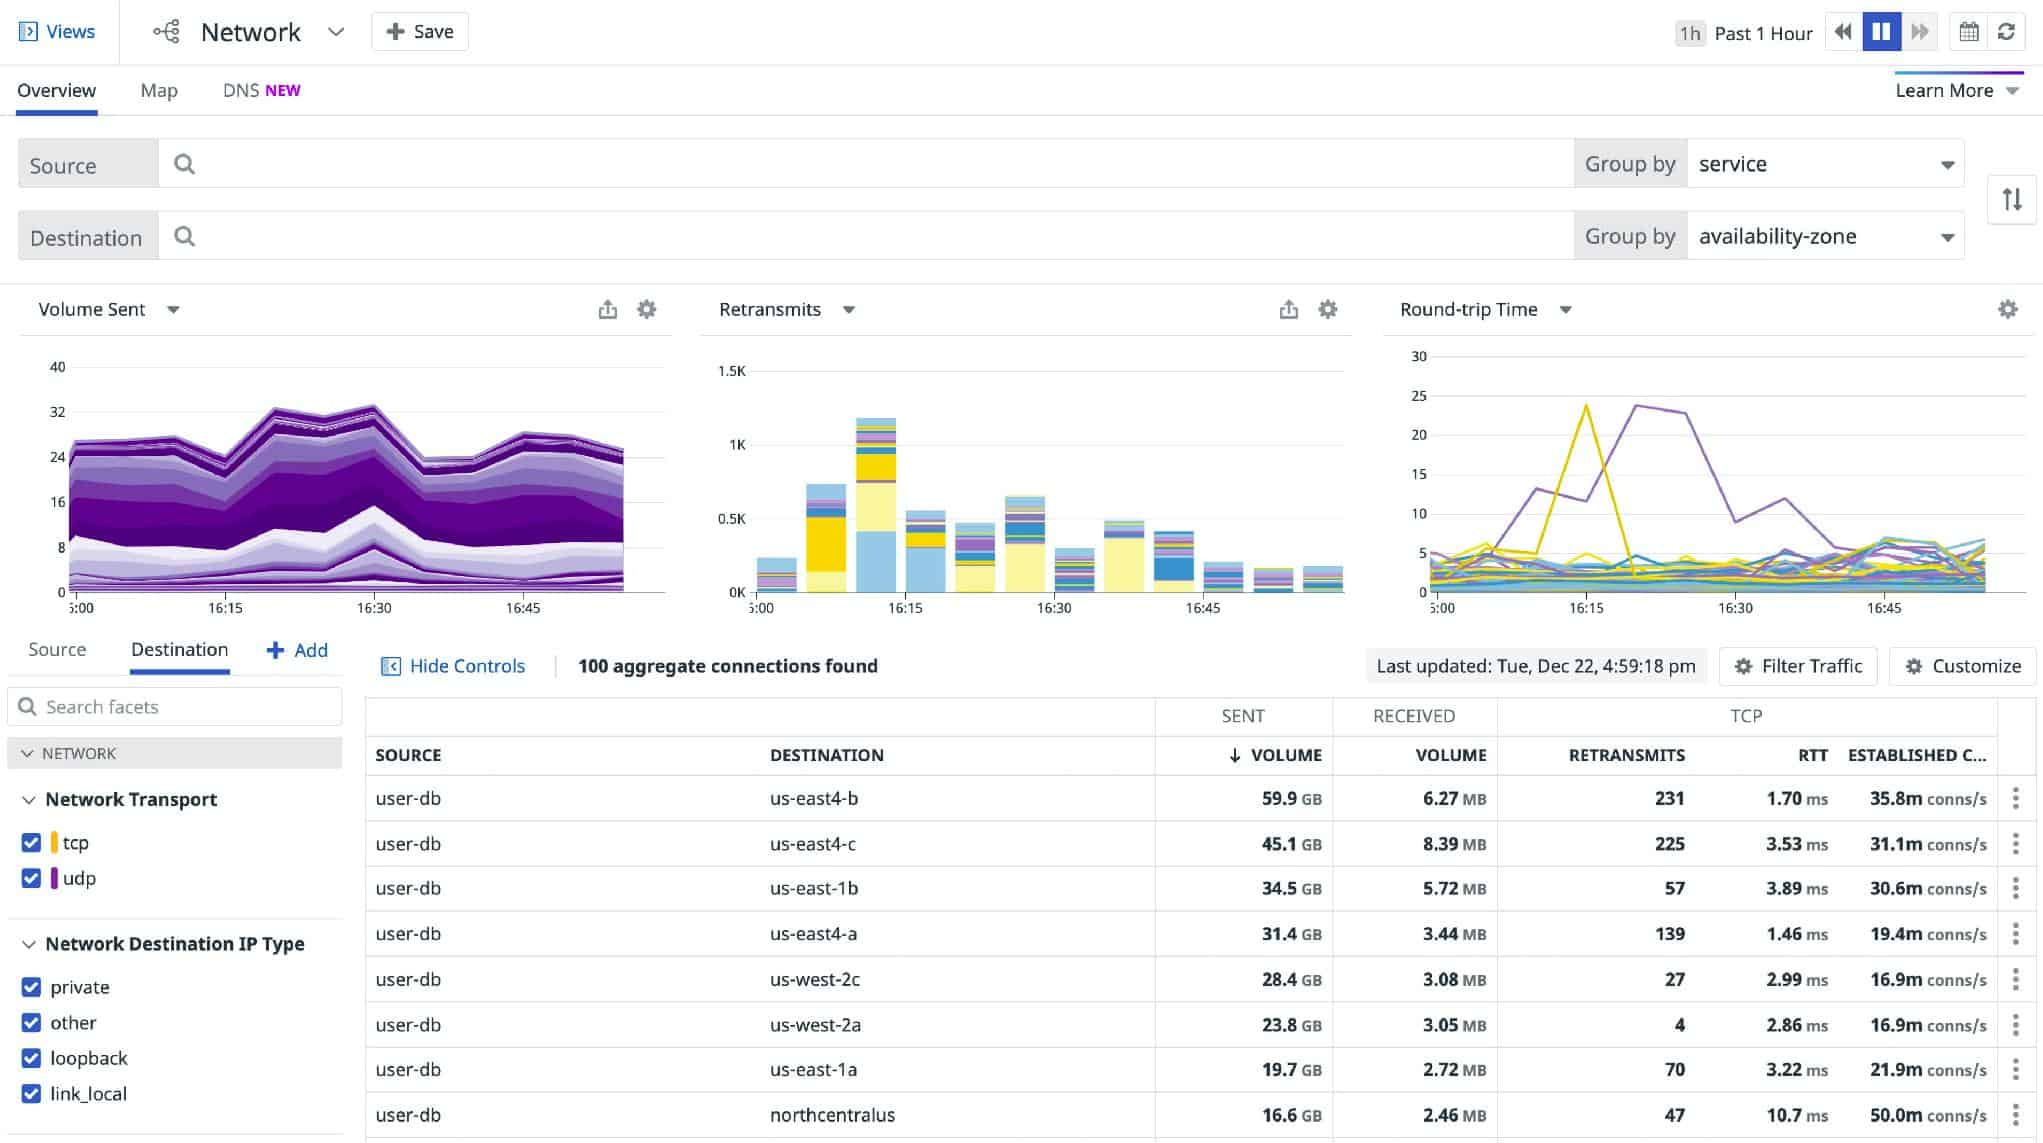
Datadog Network Monitoring provides end-to-end visibility of all connections, which are also correlated with performance issues highlighted in log messages. The dashboard for the system is resident in the cloud and accessed through any standard browser. This centralizes network performance data from many sources and covers the entire network, link by link and end to end.
You can create custom graphs, metrics, and alerts in an instant, and the software can adjust them dynamically based on different conditions. Datadog prices start from free (up to five hosts), Pro $15/per host, per month and Enterprise $23 /per host, per month.
Who is it recommended for?
The two Datadog network monitoring packages are very easy to sign up for. They work well together to get a complete view of network activities. The pair will discover all of the devices on your network and map them, then startup automated monitoring. These are very easy-to-use systems that are suitable for use by any size of business.
Pros:
- Has one of the most intuitive interfaces among other network monitoring tools
- Cloud-based SaaS product allows monitoring with no server deployments or onboarding costs
- Can monitor both internally and externally giving network admins a holistic view of network performance and accessibility
- Supports auto-discovery that builds network topology maps on the fly
- Changes made to the network are reflected in near real-time
- Allows businesses to scale their monitoring efforts reliably through flexible pricing options
Cons:
- Would like to see a longer trial period for testing
Start a 14-day free trial.
Why do we recommend it?
The SuperOps Network Monitoring is an automated system that sets itself up with network data from a network discovery service. This package improves technician efficiency by carrying out most of the routine monitoring tasks that look after the networks of MSP clients. The service is linked to modules that monitor and manage servers and software.
The RMM package is one bundle available from the SuperOps platform. The company also provides a Professional Services Automation (PSA) system that includes all of the software that the management team of an MSP needs. However, the RMM would also be useful for in-house IT departments because it is available separately from the PSA package.
The SuperOps RMM package creates value for money by improving the abilities of each technician. It extends the capacity of experts by taking all of the routine monitoring tasks off their shoulders.
The package creates and maintains a list of devices and that provides a link through to a details page on each. The service tracks switches, routers, and firewalls. It will also list the servers and workstations connected to the network. SuperOps draws up a network topology map from the data in the inventory and both update automatically if the discovery cycle identifies changes on the network.
Who is it recommended for?
SuperOps provides an RMM-only package that includes the Network Monitoring service. The RMM modules are also included in two combined plans, which include the PSA bundle as well. MSPs would probably go for those combined packages. However, the RMM-only edition makes the platform appealing to IT departments that don’t need those PSA functions.
Pros:
Cons:
Try the Network Monitoring service of SuperOps by accessing a 14-day free trial.
SuperOps Network Monitoring Start a 14-day FREE Trial!
4. Checkmk – FREE TRIAL
Checkmk is an IT asset monitoring package that has the ability to watch over networks, servers, services, and applications. The network monitoring facilities in this package provide both network device status tracking and network traffic monitoring.
Features of this package include:
Why do we recommend it?
The Checkmk combination of network device monitoring and traffic monitoring in one tool is rare. Most network monitoring service creators split those two functions so that you have to buy two separate packages. The Checkmk system also gives you application and server monitoring along with the network monitoring service.
The Checkmk system is easy to set up, thanks to its autodiscovery mechanism. This is based on SNMP. The program will act as an SNMP Manager, send out a broadcast requesting reports from device agents, and then compile the results into an inventory. The agent is the Checkmk package itself if you choose to install the Linux version or it is embedded on a device if you go for the hardware option. If you choose the Checkmk Cloud SaaS option, that platform will install an agent on one of your computers.
The SNMP Manager constantly re-polls for device reports and the values in these appear in the Checkmk device monitoring screen. The platform also updates its network inventory according to the data sent back by device agents in each request/response round. The dashboard also generates a network topology map from information in the inventory. So, that map updates whenever the inventory changes.
While gathering information through SNMP, the tool also scans the headings of passing packets on the network to compile traffic statistics. Basically, the tool provides a packet count which enables it to quickly calculate a traffic throughput rate. Data can also be segmented per protocol, according to the TCP port number in each header.
Who is it recommended for?
Checkmk has a very wide appeal because of its three editions. Checkmk Raw is free and will appeal to small businesses. This is an adaptation of Nagios Core. The paid version of the system is called Checkmk Enterprise and that is designed for mid-sized and large businesses. Checkmk Cloud is a SaaS option.
Pros:
Cons:
Start a 30-day free trial.
Checkmk Start 30-day FREE Trial
5. Progress WhatsUp Gold – FREE TRIAL
Progress WhatsUp Gold is an on-premises software package for Windows Server. Its foundation is a network device monitoring module, while the higher editions extend coverage to servers, applications, and cloud services.
Key Features:
Why do we recommend it?
Progress WhatsUp Gold is a flexible package because buyers can use it as a network performance monitor or move to higher editions that add traffic analysis and a wider set of monitoring tools. It is also straightforward to operate because the platform begins with automatic discovery, records all connected network equipment, and generates a network map without requiring manual setup.
Each WhatsUp Gold module includes thresholds and alert triggers. That alerting framework automates much of the monitoring workload because technicians do not need to watch the console constantly and can instead respond when the system reports an issue.
The alert engine comes with built-in rules, but administrators can change those defaults and add their own conditions.
Higher editions also add modules such as a log manager, a configuration manager, and an inter-site data transfer service. The wider package can monitor servers, applications, virtual environments, cloud platforms, and internet connections.
The platform also offers customizable views that support monitoring, troubleshooting, and future planning.
Who is it recommended for?
Progress WhatsUp Gold is recommended for IT teams that need on-premises network monitoring with automatic discovery, device health tracking, traffic analysis, and topology mapping. It is best suited to organizations that want Windows Server-based monitoring and may need higher editions for broader infrastructure coverage.
Pros:
Cons:
Progress offers WhatsUp Gold on a 30-day free trial.
Progress WhatsUp Gold Download a 30-day FREE Trial
6. AdRem NetCrunch – FREE TRIAL
AdRem NetCrunch is an agentless monitoring platform that can help you stay on top of your devices, applications, services, and other aspects of your network.