We may earn a commission if you make a purchase through the links on our website.
Graphite Beginner’s Guide

UPDATED: May 20, 2024
Graphite is an open-source monitoring component that is good at two things: storing numeric time-series data and generating graphs based on that data. Graphite does not provide any data collection, alerting, or monitoring mechanisms. But still, it does offer a wide range of different integrations so that you can turn it into a powerful monitoring solution.
In this beginner’s guide to Graphite, you will learn all the basics of Graphite. What is it? How does it work? And how to start implementing it? We will install Graphite on an Ubuntu server, begin its configuration, and show you a couple of essential integrations. We will close the article with a few pros and cons if you are considering using Graphite for monitoring.
Table of Contents
- What is Graphite?
- How does Graphite work?
- How to start with Graphite?
- Graphite integrations
- Graphite Pros and Cons
1. What is Graphite?
Graphite is an open-source monitoring solution that does two things: it provides highly scalable storage of numeric time-series data and generates graphs based on the stored data. Graphite provides a simple user interface that allows users to transform, combine, filter, and show time-series data in visualizations. It displays graphs either through point or line visualizations.
System and network admins can use Graphite to monitor the performance of their networks, servers, hosts, services, applications, websites, or anything capable of generating time-series data.
What is not Graphite? Graphite is not a data collection tool. It doesn’t gather data by itself but uses third-party tools to collect and send data to the Graphite server. In addition, Graphite is not an alerting system. It needs other monitoring solutions to generate alarms on its behalf.
Product Details:
- Where can Graphite run? Graphite can run on an on-premise appliance or a cloud-based infrastructure. It is supported by UNIX-based operating systems and Docker-based containers. Unfortunately, Graphite is not supported by Windows.
- License and pricing details Graphite runs under the open-source Apache 2.0 license. It is 100% free to use.
- Support Graphite does not offer any customer service. But you can get Graphite support from the DevOps community via forums and access their fantastic documentation.
- Integrations Graphite provides a massive variety of data integrations and third-party tools. You can integrate Graphite with data collection tools, data forwarding, visualization, monitoring, alerting, storage backend alternates, and others.
Background
Graphite was designed as a side project in 2006 by Chris Davis for monitoring internal resources at Orbitz. Around 2008, Orbitz allowed the once-private project to be released as an open-source time-series solution. Since then, Graphite has continued to be developed by Chris and backed by a larger community of developers.
Graphite initiated the new age of monitoring solutions; it changed the game for storing, retrieving, sharing, and visualizing time-series data. Graphite has been deployed in production to help businesses keep track of their e-commerce services and websites, and also help them plan for expansion. Although companies of all sizes still use Graphite, it is slowly losing interest over other, more complete monitoring solutions.
2. How does Graphite work?
Graphite is composed of three different components. First (Carbon), a daemon that takes in the data from third-party data collectors and provides short-term storage; second (Whisper), reliable and long-term storage; and third (Graphite Web), the web app that provides an interface to users.
- Carbon A daemon that listens to and processes time-series data. It collects data using standard methods like Plaintext, Pickle, or AMQP. Carbon uses a module known as carbon-cache as temporary storage. Carbon also uses two (optional) modules; carbon relay and carbon aggregator.
- Whisper A simple and fixed-size time-series database library. It is similar in design to RRD (Round-Robin Database) databases like Logstash. Whisper provides reliable and fast storage of numeric time series data.
- Graphite-Web A web application based on Django. Graphite Web renders graphs and dashboards and shows them in the web browser. The Memcached component is optional.
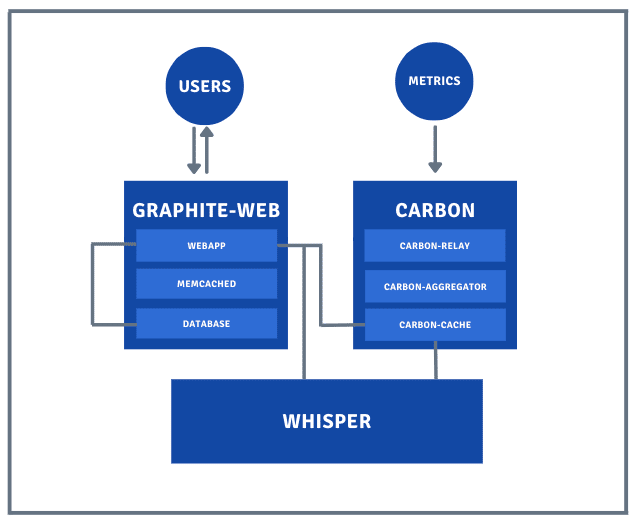
Graphite uses the server-client network architecture but does not provide the agents that collect data from clients. Instead, Graphite-Carbon gets the ‘time-series’ data from third-party data collectors (also considered data points). Carbon saves this data in Carbon-cache for immediate “hot” queries made by the user from the Graphite web app. Carbon may also write this data to the Whisper time-series library for long-term storage.
Both databases (Carbon-cache and Whisper) provide the time-series data for the Graphite web app. When the Graphite users interact with the Graphite web app, it queries these databases to build the requested graph. The Graphite web app provides the interface for the dashboard and API access.
All the data sent to the Graphite Web app becomes immediately available for graphing. The Web app provides different ways to graph time-series data; these include a simple URL API endpoint for rendering graphs and retrieving raw data. The web app can also export data through raw images, CSV, XML, or JSON, allowing admins to embed custom graphics in other web apps.
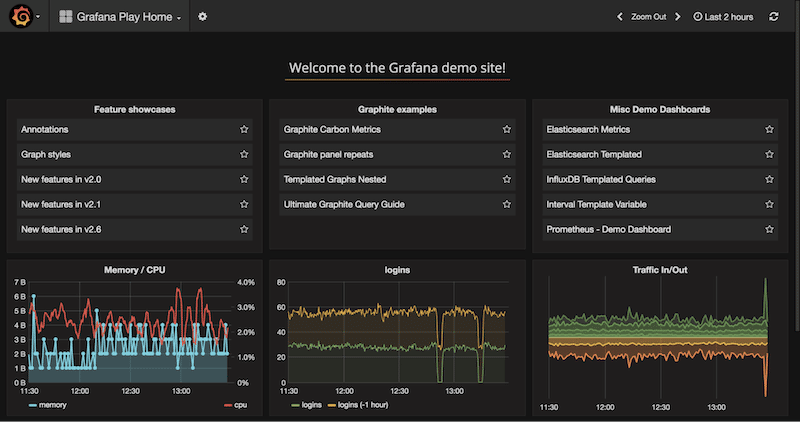
Below is an example of Graphite integrated with Grafana Dashboard. Graphite provides the metrics and storage, while Grafana provides the graphics.
3. How to start with Graphite?
There are different ways to install Graphite. You can install it from the source using Pip (package installer for Python), Virtualenv (which creates isolated Python environments), Synthesize (a script that makes Graphite easy to install on Ubuntu), and RESynthesize (forked from Synthesize and designed for CentOS distributions).
You can install Graphite in UNIX-like operating systems, including most Linux distributions. Graphite can also run on Docker containers. Graphite Docker is easy-to-install, fast, and highly portable. There is no native Graphite for Windows operating systems, but you can use a Docker container.
Our recommendation
If you have an Ubuntu 18.04 LTS available, we recommend using Synthesize to install Graphite. RESynthesize is also recommended for CentOS distributions. Another practical ‘more modern’ and commercial solution to using Graphite is the SaaS-based solution for Graphite known as Hosted Graphite. This hosted solution has improvements and additional features over the standard Graphite. It provides a well-rounded monitoring solution based on Graphite.
a. Graphite Dependencies
Some of the basic requirements before installing Graphite are:
- A UNIX-like Operating System You can install Graphite from the source in any modern Linux distribution. You can also install it using Synthesize but only on Ubuntu 18.04 LTS, while you can also use RESynthesize only on CentOS.
- Python Python 2.7 or greater (including experimental Python3 support)
- Cairo Graphics Graphite renders graphs with the Cairo graphics library, so it needs the Cairocffi package.
- Django Graphite needs Django (1.11.19 or newer is recommended) for its web user interface. Graphite also requires django-tagging 0.4.6
- Other dependencies pytz (world time zone definitions), scandir (dictionary iterator), fontconfig (font configuration and customization), and a WSGI server and web server, such as Apache or NGINX.
b. Installing Graphite with Synthesize
Synthesize makes the entire Graphite installation more straightforward and suitable for beginners. It installs Graphite and all its related services into a modern Linux distribution (Ubuntu 18.04 LTS).
The Synthesize script goes through all the essential Graphite components (Graphite-web, carbon, and whisper) and installs them individually. It also installs other vital features, including Memcached, StatsD (Statsite), collectd, and Grafana (after Synthesize v 3.0.0). The Synthesize installation results in the Graphite web interface (HTTP-port 443) ready to collect metrics, visualize data and create a profile of the Graphite service.
NOTE: Use a VM or a temporary VPS for installing Synthesize. Do not use a development or production server.
c. Download Synthesize into your Ubuntu
Download the latest and most stable version of Synthesize. You can find it at https://github.com/obfuscurity/synthesize/releases. As of Oct 2022, the newest release is Synthesize 4.0. Installing packages on Ubuntu requires you to have administrative permissions. Make sure you have privileges, or use the “sudo” command.
- Do an update of your current packages.
$ sudo apt-get update
- We are going to download Synthesize from the GitHub repository into a new directory on your local VM. To do a full clone of the remote repository, you will need ‘Git’.
$ sudo apt-get install git
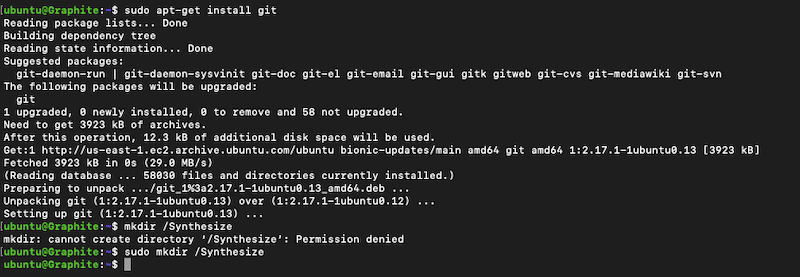
- Create a directory where you are going to download Synthesize to.
$ sudo mkdir /synthesize
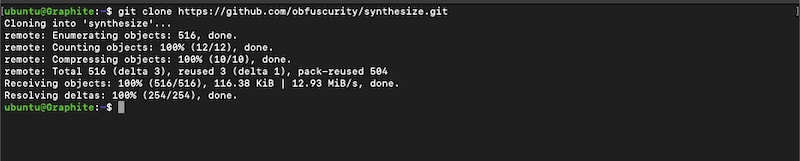
- Download or clone the Synthesize.git repository.
$ git clone https://github.com/obfuscurity/synthesize.git
- Once downloaded, go to the directory where Synthesize is stored and install it.
$ cd synthesize
$ sudo ./install
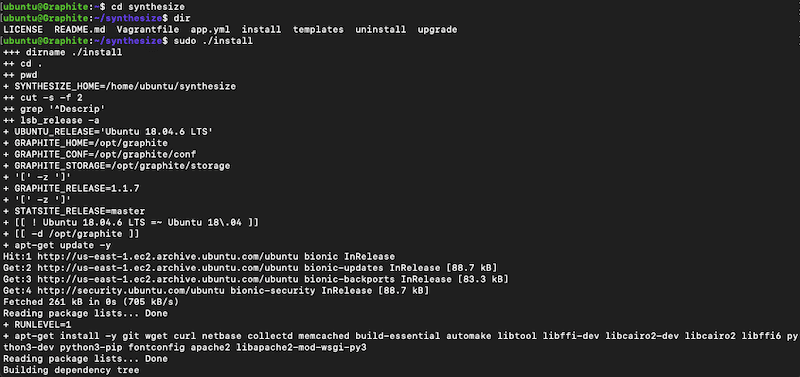
- The installation process should be completed within a few minutes.
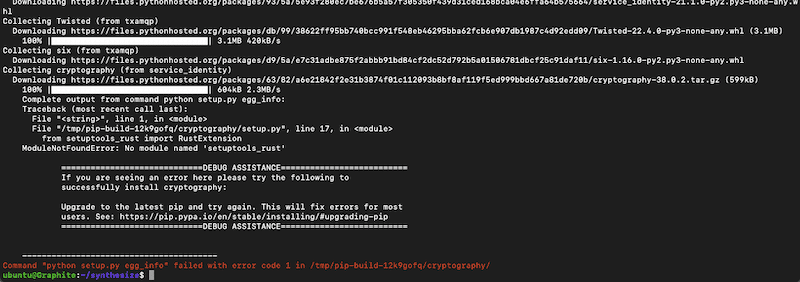
NOTE: According to the installation debug (shown below), we had a Python error regarding Cryptography. The error message reads as follows: Command “python setup.py egg_info” failed with error code 1 in /tmp/pip-build-####/cryptography/
Since we are deploying Graphite in a virtual environment, we need an updated version of PIP (standard Package Manager for Python). Simply download and get a newer version of PIP for your environment.
d. Configuring Graphite
After installing Graphite successfully, you’ll need to start configuring its components, including Carbon, Graphite-web, and Whisper. As an example, we will show you where to start with the configuration. However, the complete configuration of Graphite is beyond the scope of this beginner’s guide.
Starting with Graphite-Carbon
Any data sent to Graphite will be sent to the Carbon components, which provide ways to manage the data. Only then will the Graphite-web interface read this data from Carbon-cache or straight from Whisper’s database.
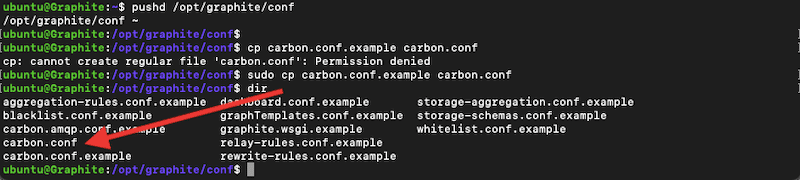
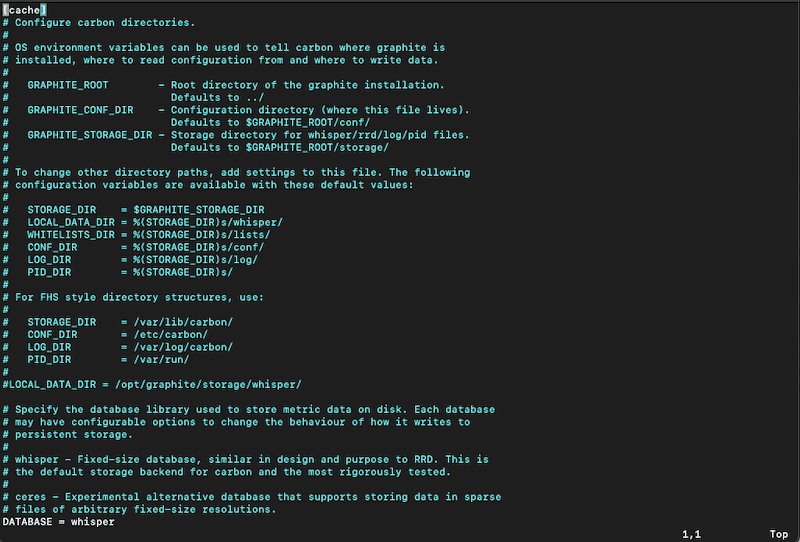
You can find all the Carbon’s configuration files in the ‘/opt/graphite/conf/’ directory. The main configuration file is the carbon.conf; it defines the settings for all the Carbon daemons.
- All those configuration files will be appended with a filename extension “.example”. Which will need to be removed to be configured. For example,
$ sudo cp carbon.conf.example carbon.conf
- Open the carbon.conf configuration file, with a text editor to change any configuration for Carbon.
$ sudo vi carbon.conf
- Additional configuring of Carbon, Graphite-web, or the Whisper database is beyond the scope of this beginner’s guide.
4. Graphite Integrations
As stated at the beginning of this guide, Graphite is the best at two things: it provides storage for numeric time-series data and generates graphics. But that’s it; Graphite does not collect, forward, or monitor data. To get the most from Graphite, you will need to integrate it with other tools.
Some of the most popular tools that work great with Graphite and even complement each other are:
a. collected
collectd is a popular open-source data collection tool. It is a UNIX-based demon written in C and designed to collect system and application performance metrics. collectd also provides various mechanisms for storing or sending this data. It uses write plugins to send its collected data to other daemon applications such as Graphite. The collectd Write Graphite plugin connects to Graphite-Carbon and stores its values for graphing with the Graphite web app.
How to Integrate collectd with Graphite?
On the collectd server, open the collectd.conf file with your favorite text editor and enable the plugin (by removing the #) on #LoadPlugin “write_graphite” and then scroll down to configure the particular plugin block “write_graphite” For instance:
LoadPlugin "write_graphite"
<Plugin "write_graphite">
<Node "example">
Host "localhost"
Port "2003"
EscapeCharacter "_"
SeparateInstances true
StoreRates false
AlwaysAppendDS false
</Node>
</Plugin>
b. Riemann
Riemann is an event stream aggregator with a powerful stream processing language. A Riemann client collects events from systems and applications and sends them to the Riemann server. This server will filter, aggregate, and process all these events. Riemann, by itself, does not provide end-to-end monitoring; it is simply an event aggregator that can be easily integrated with storage and graphing systems like Graphite.
How to integrate Riemann with Graphite?
If you know how to program in Clojure, integration in Riemann can be a straightforward process. Otherwise, you’ll need to have the basics of Clojure. To forward event streams to Graphite, you’ll need first to define a Riemann client and then use this client as a stream. As an example:
(def graph (graphite {:host "my.graphite.server"}))
(streams
(where (service "thing-to-graph")
graph))
(streams
graph)
c. Host sFlow
Host sFlow is an open-source implementation of the sFlow protocol. It uses an agent known as host-sflow, which uses the sFlow protocol to export server and system performance. This software can be installed in many different virtual or hardware systems, including network devices, servers, and infrastructure. The HostsFlow agent collects and exports these performance metrics to a monitoring or management software that can use sFlow, like Graphite.
How to integrate Host sFlow with Graphite?
To integrate Host sFlow with a ‘sFlow collector’ to store and display data such as Graphite, follow these steps:
- First, install the sflowtool on the Graphite server. This script converts standard sFlow records into different formats.
- Download the sflow2graphite script to convert Host sFlow metrics to be used in Graphite. You can download it from GitHub.
- On the Graphite server, run the following command: ./sflow2graphite.pl
- Set up the Host sFlow agents to forward sFlow metrics to the Graphite server.
d. Sensu
Sensu (by Sumo Logic) is a fantastic open-source observability solution designed for scale. It can help observe different resources deployed in the cloud or on-premise, such as applications, services, containers, and VMs. Sensu can also be extended to cover additional capabilities with its integrations, plugins, and APIs. This observability tool can be easily integrated with Graphite because it comes with the Sensu Graphite Handler plugin that sends Sensu metrics to the Graphite database to be stored and visualized.
How to Integrate Sensu with Graphite?
You can either integrate Sensu with Graphite with the Sensu Graphite Handler plugin for a more customizable integration or use the Graphite.yaml template for easier integration. To integrate with the Sensu Graphite Handler plugin, you’ll need to define assets, checks, and handlers. Below is an example of the handler definition.
{
"api_version": "core/v2",
"type": "Handler",
"metadata": {
"namespace": "default",
"name": "graphite"
},
"spec": {
"type": "pipe",
"command": "sensu-go-graphite-handler",
"timeout": 10,
"filters": [
"has_metrics"
]
}
}
e. Nagios Core
Nagios Core is an open-source monitoring solution. It can keep track of different aspects of a network, including system metrics, services, applications, network protocols, servers, and more. Nagios Core also comes with an alerting and notifications system to keep admins informed at all times. In addition, Nagios Core can also be easily integrated with third-party tools like email services, log management, and graphics and databases like Graphite.
How to Integrate Nagios Core with Graphite?
- Nagios Core can be integrated with Graphite via its check_graphite_metric plugin. This is useful if admins want to visualize systems metrics using an already deployed Graphite.
- Download the plugin/check code from its official GitHub repository.
- Compile and install.
5. Graphite Pros and Cons
Graphite has been a favorite monitoring solution for many years. It provides advanced queries and functions that facilitate methods for displaying metrics. However, Graphite has been slowly taken over by other more complete monitoring solutions such as Prometheus or Grafana. End-to-end monitoring solutions like Prometheus, for instance, provide data collection, storage, queries, graphs, and alerts— all in a single tool.
In another case, Graphite graphs and visualizations are also becoming obsolete. Other tools like Grafana can provide better visualizations through more beautiful and interactive web-based dashboards. But still, Graphite provides added value to Grafana for metrics storage and collection.
Below is a short list of the pros and cons of using Graphite.
Pros:
- Integrations Although Graphite is not an end-to-end monitoring solution, it can be integrated with other tools to form a robust monitoring system. For instance, third-party monitoring agents such as collectd or Diamond can send time-series metrics to Graphite. Additionally, Graphite can be integrated with other powerful tools such as Riemann, Nagios Core, sFlow, Logstash, and many more.
- High redundancy and reliability Graphite provides good redundancy and reliability. You can define all metrics to be sent from anywhere to a central Graphite server and add a storage cluster for redundancy.
Cons:
- Lack of data collection agents Although you could integrate Graphite with data collection tools like collectd or Riemann, Graphite does not provide native data collection agents, which for many system admins, is a significant limitation. Graphite’s mode of collecting data is passive, meaning that while Graphite listens, other applications must be configured to send the data to Graphite Carbon.
- Lack of alarm system Although you could track events with Graphite, it does not provide any alert or alarm management system. Alerting with Graphite must be managed separately via other monitoring and alerting tools.
- Limited supported programming language Graphite only supports JavaScript and Python. When developers implement code instrumentation to monitor components in systems and networks, and they want to push metrics to Graphite from different languages, Graphite can be limited. But still, thanks to its integrations, Graphite can be bounded with virtually any language.
- Deployment difficulty Graphite uses three different components that must be installed and configured separately if installed from the source. Plus, Graphite alone won’t provide value unless integrated with a data collection tool. All this makes Graphite challenging to deploy.
- Problems with scalability Graphite doesn’t have a good reputation for its scalability. The tool might not respond well when many active data points send lots of data within short periods. Graphite is originally written in Python, which is unsuitable for large enterprise-wide environments. There could be performance and process management issues.