We may earn a commission if you make a purchase through the links on our website.
Nagios Core Beginner’s Guide

UPDATED: May 20, 2024
Nagios Core is a fantastic open-source network, server, and infrastructure monitoring tool. It can help monitor different types of devices, including Linux, Windows, macOS, virtual machines, or network devices. Nagios Core uses plugins to extend its monitoring to clients, uses alerts to inform admins, and can also be integrated with third-party tools.
In this beginner’s guide to Nagios Core, you’ll learn everything there is to know about Nagios Core on a fundamental level. You’ll learn about Nagios Core’s background, how it works, how to install it from zero, how to test it, how to install plugins, and more.
Table of Contents
- What is Nagios Core?
- Nagios Background.
- How Does Nagios Core Work?
- How to Start with Nagios Core?
- Starting with Nagios plugins
- Nagios Core Pros and Cons
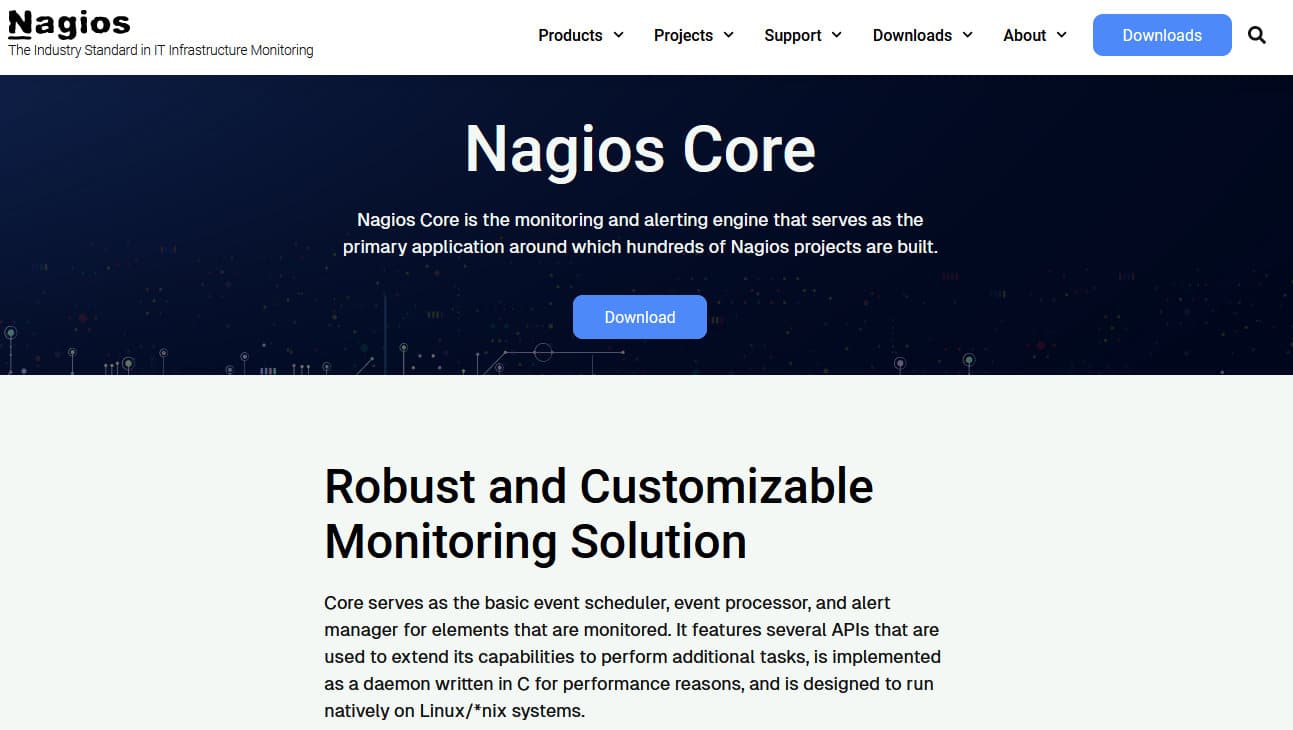
1. What is Nagios Core?
Nagios Core (formerly Nagios) is a free and open-source continuous monitoring and alerting engine for systems, networks, and infrastructure. Nagios Core was the foundation for developing the enterprise-level monitoring solution Nagios XI. With Nagios Core, IT admins and network managers can keep track of system metrics (CPU, memory, temperature), services and applications (SMTP, POP3, HTTP, etc.), network protocols (IP, Telnet, DHCP), servers, and network infrastructure.
Nagios Core also comes with an alerting system that informs admins whenever any of these ‘monitored objects’ fail (or recover) so that they can respond immediately. Nagios core provides alerts via SMS, email, or custom scripts.
System admins can only deploy Nagios Core on Linux or Unix platforms, but they can deploy agents (monitored objects) on different systems, including Linux, macOS, and Windows. Nagios Core can perform active or passive checks. Finally, Nagios Core also provides a simple but effective reporting capability. You can create reports on Nagios Core, output them to HTML, and send them through CRON.
a. Nagios Core product details:
- Server (Nagios Core) supported platforms Nagios Core was designed to run on Linux but can also run on Unix platforms. You can install Nagios Core manually on the following platforms: CentOS, RHEL, Fedora, Ubuntu, Debian, Arch, Solaris, Apple OS X, IBM Power, and more.
- Agent (Nagios Core) supported platforms The Nagios agent is a cross-platform application. It can be installed on Windows, Linux, or Mac.
- Nagios Core use cases Nagios Core can be used as a monitoring solution for small-medium networks, including many services, servers, infrastructure, and Virtual Machines. Nagios Core is an ideal solution to complement operations and management.
- Pricing Being open-source and supported by the Nagios community, Nagios Core (single license) is 100% free. When it comes to the Nagios XI, its price starts at $1,995 (Standard Edition) and $3,495 (Enterprise Edition).
- Downloads You can download the latest and most stable version of Nagios Core from its official site or Sourceforge. Either way, you’ll download the source code in tar.gz format.
b. Nagios Core vs. Nagios XI: What are their differences?
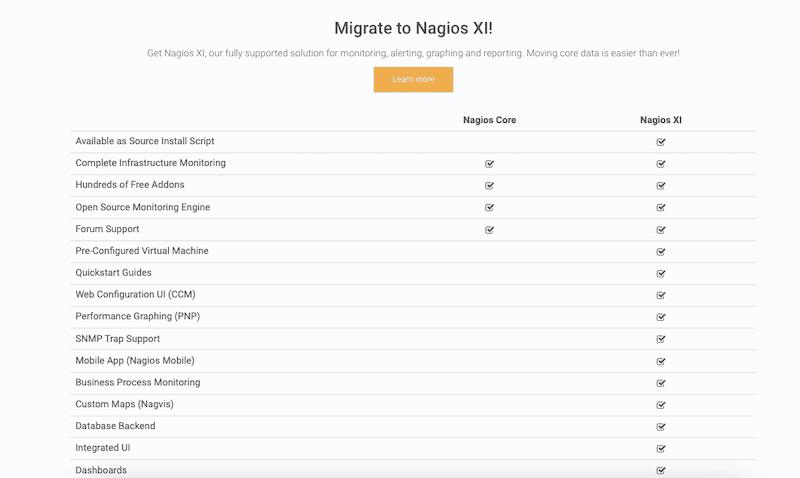
The differences between Nagios Core and Nagios XI are commercial. On the one side, Nagios Core is open-source and free software for monitoring infrastructure (it can also be used in enterprises.) On the other hand, Nagios XI is the commercial enterprise version of Nagios Core. Being commercial, Nagios XI comes with far more features, such as reporting, logging, built-in plugins, phone and email support, SMTP trap support, and more.
Nagios Core can only be installed on Linux and Unix. But Nagios XI (enterprise edition) can be installed on Microsoft Windows (via VM), different Linux distros, and VMWare. Below is a screenshot with some of their differences.
2. Nagios Background
Nagios (previously NetSaint) was created in 1996 as a simple application to perform server checks and send pages. It was later released as an open-source project for hosted monitoring and plugins to extend monitoring. The Nagios leading developer (Ethan Galstad) changed the name from NetSaint to Nagios, which stands for (Nagios Ain’t Gonna Insist On Sainthood).
Nagios quickly started gaining interest among system and network admins. It was a finalist in the category: “Best Tool or Utility for SysAdmins” of the SourceForge.net 2007 Community Choice Awards, and it also won in the “Server Monitoring category for the InfoWorld’s Best of Open Source Software (“BOSSIE”) 2008 Award winners.
In 2009, Nagios started offering enterprise support via its first commercial monitoring product Nagios XI, and Nagios (the original application) was renamed Nagios Core. In 2010 (for the fourth year in a row), Nagios won the LinuxQuestions.org “Network Monitoring Application of the Year”.
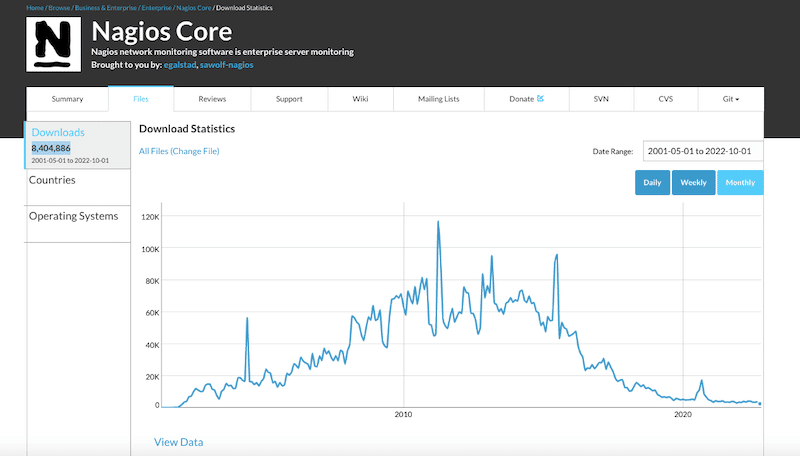
From 2010 to 2015, Nagios was one of the favorite open-source network monitoring solutions. Fast forward to 2022, and Nagios Core has been downloaded 8.4 million times from SourceForge.net. Although still loved by the monitoring community (especially among Linux admins), its roaring popularity started to decrease in 2016. It is believed that this loss of interest started when other more ‘automatic’ and easier-to-deploy tools started to appear.
3. How Does Nagios Core Work?
Nagios uses the simple server-client network architecture. The Nagios client is the monitored host or system, also referred to as an object. This monitored object (either local or remote) runs a Nagios agent in the background that is in charge of collecting metrics data (CPU, memory, network, etc.) and sending it back to the server.
The Nagios server, on the other hand, is “usually” a Linux platform hosting the Nagios Core monitoring application. The Nagios Core server processes events; it checks scheduling, execution, and processing and manages events and alerts for all the monitored objects.
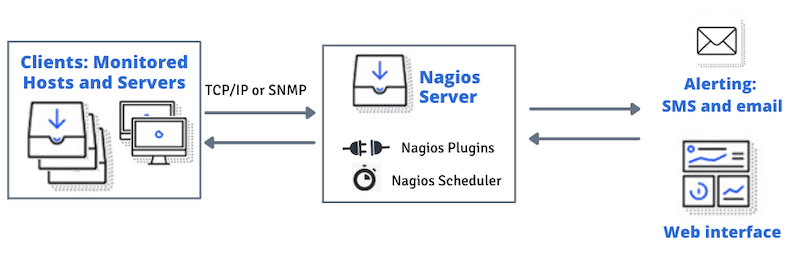
The Nagios server-client communication flow works as follows: There are usually three steps in this process: the object, the server, and the status.
- The server The server periodically sends instructions to the monitored object to execute a plugin. It stores and processes the results of these instructions; if the results change, the server could also run other scripts.
- The object These remote agents (objects) running the Nagios plugin gather the status requested by the server (CPU, memory utilization, etc.) and send them back to the Nagios process scheduler. The Nagios client may get either active or passive checks. Active checks are requested by the Nagios plugins and use either TCP/IP or SNMP protocols. Passive checks, on the other hand, gather performance data from application servers that can be used to feed an RRD database.
- The status The Nagios scheduler process in the Nagios Core server updates the Graphical Web Interface (GUI) and sends notifications (or alerts) via SMS or emails back to the admin. In addition, the performance data (from passive checks) can be saved in the RDD database to be used for graphing with displaying tools such as rrd2graph.
4. How to Start with Nagios Core?
In this guide, we will install Nagios Core from the source code. As mentioned at the beginning of this guide, you can install Nagios Core in a different wide range of Linux distributions, including CentOS, RHEL, Fedora, Ubuntu, and more.
Note: The installation process will vary from distribution to distribution and version to version. To illustrate the entire installation process, we will install Nagios Core on an Ubuntu 22.04 virtual machine.
a. Let’s work on the Nagios Core requirements
- Start by downloading and installing the updates for every outdated package and dependency in your server. For Ubuntu, use the following command:
$ sudo apt-get update
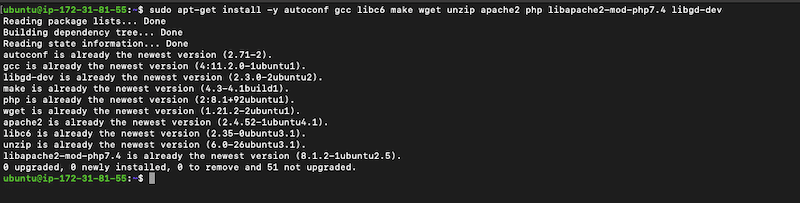
- Now, let’s install various package requirements, such as autoconf, gcc, libgd-dev, make, libc6, apache, phph, etc. Use the following command to install them all.
$ sudo apt-get install -y autoconf gcc libc6 make wget unzip apache2 php libapache2-mod-php7.4 libgd-dev
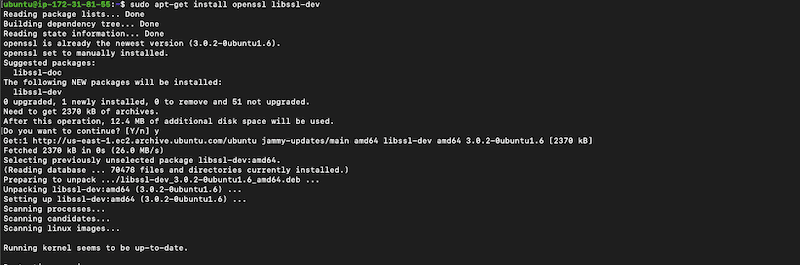
- Now let’s install OpenSSL 1.1.1 and libSSL packages.
$ sudo apt-get install openssl libssl-dev
b. Download the Nagios Core source
- You can find the latest and most stable Nagios Core source code at github.com/NagiosEnterprises/nagioscore. The latest version as of Oct 2022 is nagios-4.4.8.
- Use the following commands to download the Nagios Core package and extract it.
$ cd /tmp
$ wget -O nagioscore.tar.gz https://github.com/NagiosEnterprises/nagioscore/archive/nagios-4.4.8.tar.gz
$ tar xzf nagioscore.tar.gz
c. Now, let’s compile the program
$ cd /tmp/nagioscore-nagios-4.4.8/
$ sudo ./configure --with-httpd-conf=/etc/apache2/sites-enabled
$ sudo make all
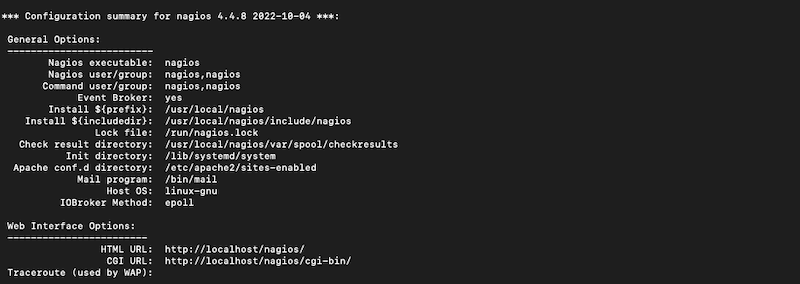
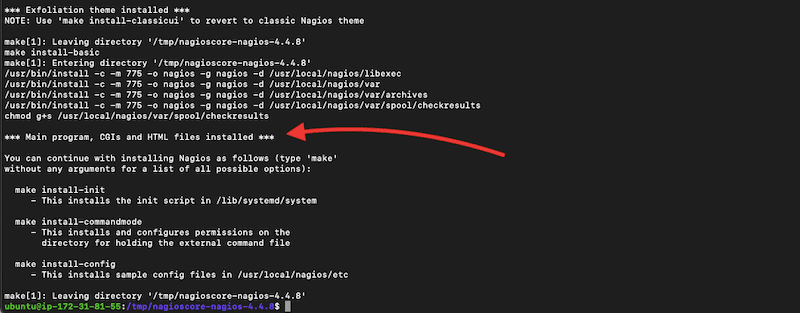
- If the Nagios Core program and CGIs are compiled successfully (without errors,) you can now continue with the Nagios configuration and testing.
- When the compile is finished, you’ll see a list of “makes” that can help you install, configure, test, etc.
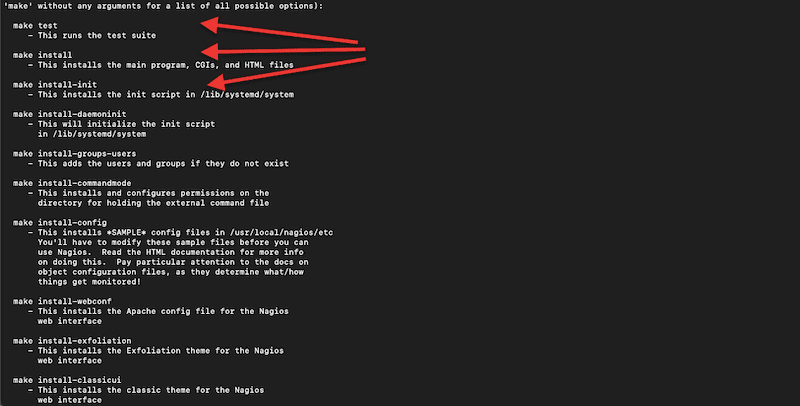
d. Let’s create a Nagios user and group
- Now that you know the make commands list, let’s create a Nagios user and group. To run the following command, you’ll need to be in the directory where the source is located (for instance, /tmp/nagioscore-nagios-4.4.8/):
$ sudo make install-groups-users
$ sudo usermod -a -G nagios www-data

e. Let’s install the binaries, service files, command, and sample configuration
- The following command installs the main program (binary files), the CGIs, and the HTML files.
$ sudo make install
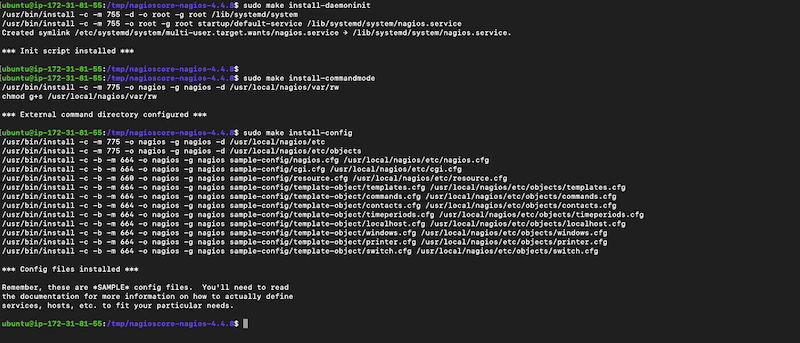
- Now, let’s install the deamon. The following command installs the service (or daemon) files. It also configures them to start from the boot.
$ sudo make install-daemoninit
- Now, let’s install and configure the external command file:
$ sudo make install-commandmode
- Let’s install the ‘sample’ configuration files. Don’t skip this step, as Nagios needs to have a configuration file to allow it to start. If you followed this step-by-step guide, the sample configuration files would be installed in the /usr/local/nagios/etc/ directory
$ sudo make install-config
f. Install Apache Config Files
- The following set of commands install the Apache configuration files and sets up the web server. The a2enmod script enables the CGI and rewrite modules within the Apache configuration. Similar to the previous commands, you’ll need to be in the directory where the source is located to run the command.
$ sudo make install-webconf
$ sudo a2enmod rewrite
$ sudo a2enmod cgi
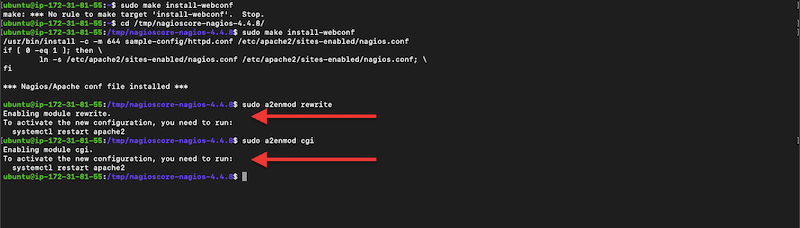
- To enable these two modules, you’ll need to ensure the Apache2 service is up and running. Use the following command to restart, and the next to ensure the service is up and running.
$ sudo systemctl restart apache2
$ sudo systemctl status apache2
g. Additional configuration
- Configure the local firewall (ufw) To reach the Nagios Core web interface, you’ll need to allow inbound traffic for port 80 (HTTP). Issue the following commands.
$ sudo ufw allow Apache
$ sudo ufw reload
- Create an Apache user account for Nagios To ensure that Apache can log into Nagios, you’ll need to create an admin account. Create a user ‘nagios’ and setup up a password.
$ sudo htpasswd -c /usr/local/nagios/etc/htpasswd.users nagios
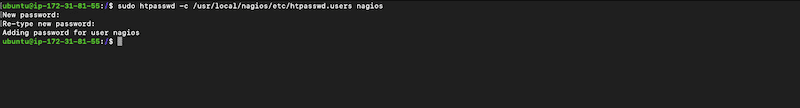
- Note that the ‘-c’ argument (in the previous command), creates a new file. If you want to create more users using the “sudo htpasswd” command, remove this ‘-c’ argument, as it will replace the first and any user created in this file.
h. Start the Nagios service and test it
Let’s start the Nagios service and ensure that it is running.
$ sudo systemctl start nagios
$ sudo systemctl status nagios
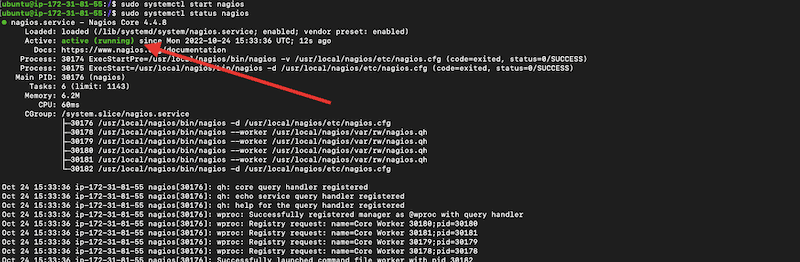
- As you would be able to see from the output of the previous command, the Nagios service is active and running. But still, you’ll need to log into the Nagios web interface to ensure that all the configuration is ok.
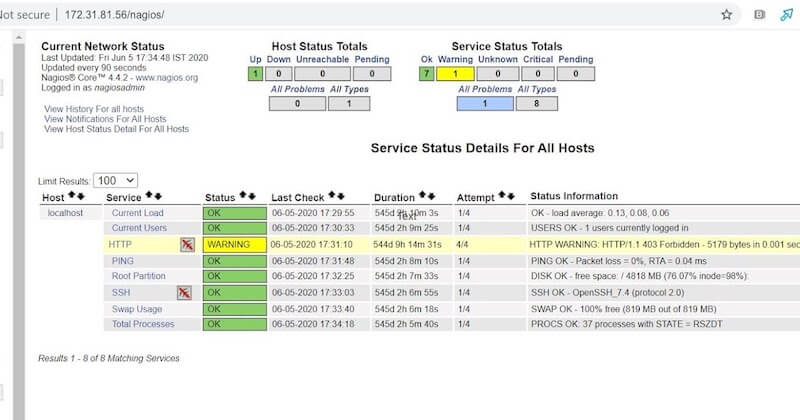
- Open your web browser and write the IP address or hostname of the Nagios Core server (i.e. 172.31.81.56/nagios) or ‘localhost’ if it is configured on the same machine. You’ll be prompted for credentials. Use the ones created previously for Apache.
- If you follow step by step through the installation process, the Nagios interface should look as follows.
Trouble?
If you followed the steps in the previous section, you probably noticed that although the Nagios service is active and running, there is still an error on the output of the ‘sudo systemctl status’ Nagios command that reads:
(No output on stdout) stderr: execvp(/usr/local/nagios/libexec/check_ping, ...) failed. errno is 2: No such file or directory
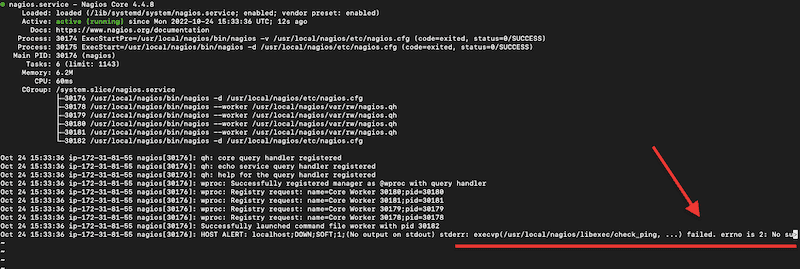
This error indicates that Nagios Core won’t work because it can’t find plugins. By default, the source for nagios-plugins will install to this directory ‘/usr/local/nagios/libexec’, but now it is empty.
Continue to the next section to learn how to install Nagios plugins.
5. Starting with Nagios plugins
Without plugins, Nagios Core wouldn’t work. Plugins are extensions of Nagios Core that help monitor anything.
The Nagios server uses these plugins— scripts (Perl, Shell, etc.) to check the status of the monitored object. The plugins process command-line arguments, perform checks and provide the results to the Nagios Core server. Nagios uses the results provided by these plugins to determine the current status of the objects.
a. How to install Nagios plugins?
Note that the plugins that come with the initial Nagios Plugins package follow the same installation process. However, different (third-party) plugins may require different libraries that you would need to install separately. Bear in mind that to install plugins, you’ll need privileged access to the Nagios Core server.
In this guide, we will only install the common set of packages required for the common Nagios Core plugins.
b. Prerequisites
- Before installing these packages, make sure to update the system’s package repository.
$ sudo apt-get update
- Install the following set of packages.
$ sudo apt-get install -y autoconf gcc libc6 libmcrypt-dev make libssl-dev wget bc gawk dc build-essential snmp libnet-snmp-perl gettext
- You might be asked to restart your system (because not all services were restarted). If your server is not in production, go ahead and restart it. If it is in production, restart it during low-traffic hours.
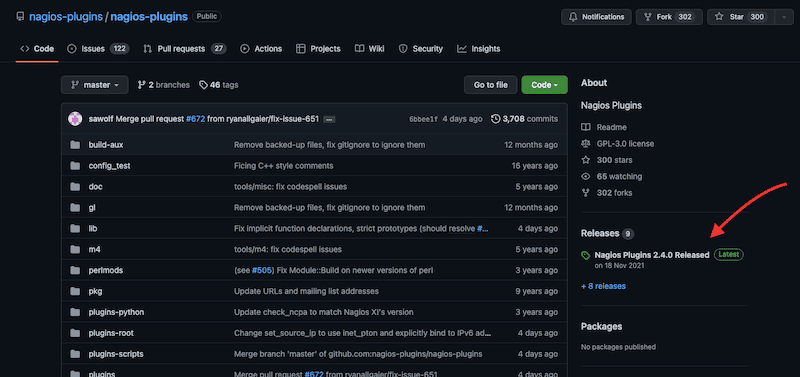
c. Downloading the Nagios Core Plugins
Download the Nagios Core plugins source from the main GitHub repository. Please, note that the latest release as of Oct 2022, is Nagios Plugins 2.4.0 (released on 18 Nov 2021). Newer versions of Nagios Core, such as the one we installed (4.4.8) should work fine with this release of plugins.
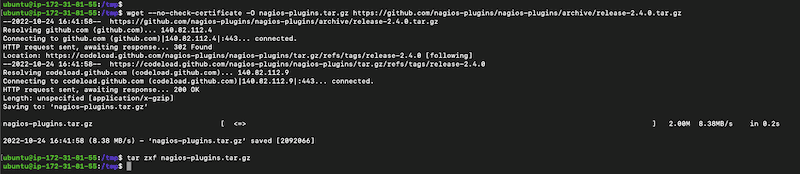
- Go back to your Nagios Core server. Go to the tmp directory, download Nagios plugins, and extract the download.
$ cd /tmp
$ wget --no-check-certificate -O nagios-plugins.tar.gz https://github.com/nagios-plugins/nagios-plugins/archive/release-2.4.0.tar.gz
$ tar zxf nagios-plugins.tar.gz
d. Let’s compile and install the Nagios Core Plugins
- Note that we are using ‘sudo’ for every command in Ubuntu.
$ cd /tmp/nagios-plugins-release-2.4.0/
$ sudo ./tools/setup
$ sudo ./configure
$ sudo make
$ sudo make install
- If installed successfully, you should be able to see a list of Nagios plugins under the directory > /usr/local/nagios/libexec/

- Check whether the Nagios service is up and active.
$ sudo systemctl status nagios
- If it is not, use the following command. Or restart it.
$ sudo systemctl start nagios
$ sudo systemctl restart nagios
6. Nagios Core Pros and Cons
a. What are the benefits of using Nagios Core?
There are many good reasons to use Nagios Core; these include being free and open source, its robust monitoring, its extensibility, stability, and a wide number of integrations. Of course, Nagios XI (at a price) provides improvements to the Nagios Core platform, but still, being a free product is what makes many system admins still prefer Nagios Core.
- Free and open source One of the main advantages of Nagios Core is that it is 100% open-source and free. If you have the Linux skills to install and configure Nagios Core, it can be a fantastic ‘free’ addition to your network monitoring solution. Additionally, Nagios Core is supported and developed by a solid community of members that offer free support via a forum. The Nagios Core community has also built an extensive knowledge base for additional support.
- Robust and wide monitoring Although Nagios Core is a “free monitoring product,” it is still as robust and capable as other commercial solutions. Nagios Core can collect a wide range of metrics data (such as CPU, memory, disk, etc.) and displays results in real-time. Nagios Core can track almost any network device, host, or server on a network.
- Extensibility Another well-known advantage of the Nagios Core is its extensibility. On a basic level (with common Nagios plugins), Nagios Core can monitor basic but vital system metrics. But as demand increases, you can start deploying additional third-party plugins that can extend the functionality of Nagios Core.
- Integrations Nagios Core can also be integrated with multiple and different services. For instance, you can integrate Nagios Core with tools you are already using, like email services, graphics tools, dashboards, log management tools, and many more.
b. What to Watch for When Using Nagios?
Nagios Core is limited in some areas and needs improvement in others. Below is a brief list of some of the cons that you should be aware of when starting to use Nagios Core as a monitoring solution.
- Scalability One of the major concerns of system admins when using Nagios Core is its lack of scalability. Although Nagios Core provides basic information on the environment and would be able to handle small to medium networks, as networks grow and become distributed, Nagios Core starts becoming too difficult to monitor. To decentralize Nagios architecture, many system admins find themselves creating different instances of Nagios Core, which can become quite difficult to manage.
- GUI Although Nagios Core provides a graphical frontend (GUI), system admins often complain that it is not user-friendly. It can be challenging to configure multiple hosts and services and keep an eye on all of them daily. A major difference between Nagios Core and Nagios XI is that with Nagios XI, you can do everything in the GUI, while with Nagios Core, you’ll need to do backend configuration in its shell-based interface.
- Technical expertise With Nagios Core, all plugins need to be configured manually and individually. So, system administrators need advanced Linux knowledge to hard-code everything (on a backend). They would need to edit files, directory permissions, configure log generations, and more. A major difference between Nagios XI and Core is that all of this is pre-built with Nagios XI.